Model Fitting: Generalized Linear Models
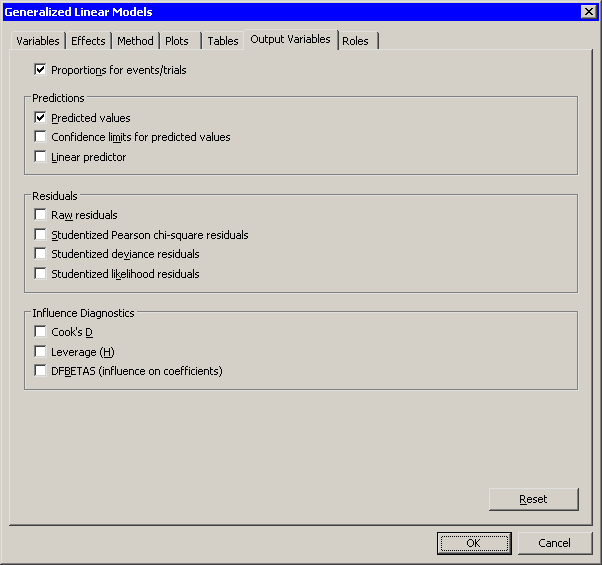
You can use the Output Variables tab to add analysis variables to the data table. (See Figure 24.24.) If you request a plot that uses one of the output variables, then that variable is automatically created even if you did not explicitly select the variable on the Output Variables tab.
For a multinomial response, residuals and influence diagnostics are not available.
The following list describes each output variable and indicates how the output variable is named. Y represents the name of the response variable. If you use events/trials syntax, then Y represents the name of the events variable.
- Proportions for events/trials
-
adds a variable namedProportion_ , where E is the name of the events variable and T is the name of the trials variable. The value of the variable is the ratio
  . This variable is added only when you use events/trials syntax.
- Predicted values
-
adds predicted values. The variable is namedGenP_Y. - Confidence limits for predicted values
-
adds 95% confidence limits for the predicted values. The variables are namedGenLclm_Y andGenUclm_Y. - Linear predictor
-
adds the linear predictor values. The variable is namedGenXBeta_Y. - Raw residuals
-
adds residuals, which are calculated as observed values minus predicted values. The variable is namedGenR_Y. - Pearson chi-square residuals
-
adds the Pearson chi-square residuals. The variable is namedGenChiSqR_Y. - Deviance residuals
-
adds the deviance residuals. The variable is namedGenDevR_Y. - Likelihood residuals
-
adds the likelihood residuals. The variable is namedGenLikR_Y. - Cook’s D
-
adds Cook’s D influence statistic. The variable is namedGenCooksD_Y. - Leverage (H)
-
adds the leverage statistic. The variable is namedGenH_Y. - DFBETAS (influence on coefficients)
-
adds p variables, where p is the number of parameters in the model. A classification variable with k levels counts as k parameters. The variables are scaled measures of the change in each parameter estimate and are calculated by deleting the ith observation. Large values of DFBETAS indicate observations that are influential in estimating a given parameter. Belsley, Kuh, and Welsch (1980) recommend as a size-adjusted cutoff. The variables are named
 DFBeta , for
, for  .
.