Model Fitting: Generalized Linear Models
The two box plots indicate that both drug and disease affect the change in blood pressure in the experimental subjects. Kutner (1974) proposed a two-way analysis of variance model for these data. You can use the Generalized Linear Models analysis to determine
which effects are significant and to estimate parameters in the model. However, note that the analysis does not create an
ANOVA table, since the GENMOD procedure does not produce ANOVA tables.
To begin the analysis:
-
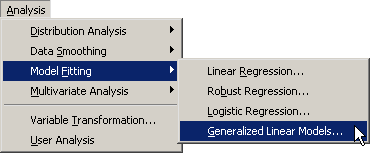
Select → → from the main menu, as shown in Figure 24.5.
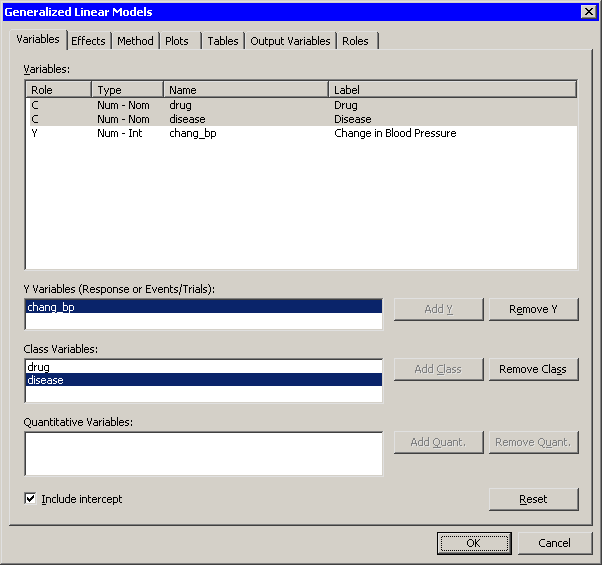
The Generalized Linear Models dialog box appears. (See Figure 24.6.)
-
Select
chang_bp, and click . -
Select
drug. While holding down the CTRL key, selectdisease. Click .Note: Alternatively, you can double-click a variable to automatically add it as an explanatory variable. Nominal variables are automatically added as classification variables; interval variables are automatically added as quantitative variables.
When you add explanatory variables to the model by using the Variables tab, the main effects for those variables are automatically added to the Effects tab. It is not clear from the box plots whether
druganddiseaseinteract. By adding an interaction term, you can determine whether the level ofdrugaffects the change in blood pressure differently for different levels ofdisease.To add an interaction term to the model:
-
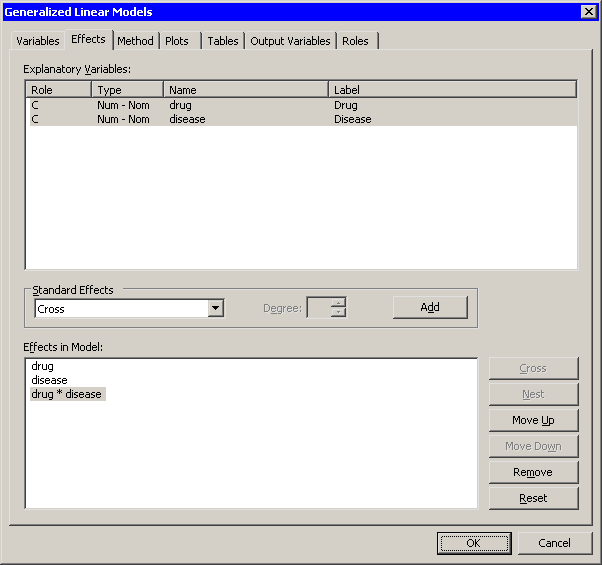
Click the Effects tab.
-
Select
druganddiseasefrom the list. -
Select from the list, if it is not already selected.
-
Click .
The interaction term
drug*diseaseis added to the list, as shown in Figure 24.7. -
Click the Method tab.
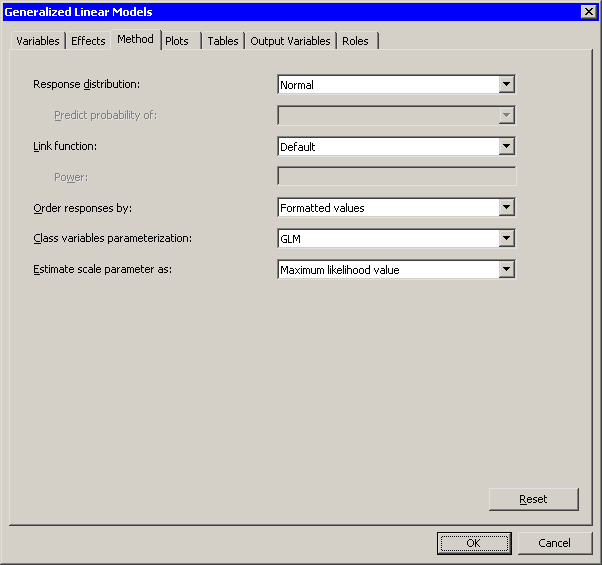
The Method tab enables you to specify aspects of the generalized linear model such as the response distribution and the link function. (See Figure 24.8.) The default distribution for the response is the normal distribution, and the default link function is the identity function. You do not need to modify this tab since these choices are appropriate for the current analysis.
-
Click the Tables tab.
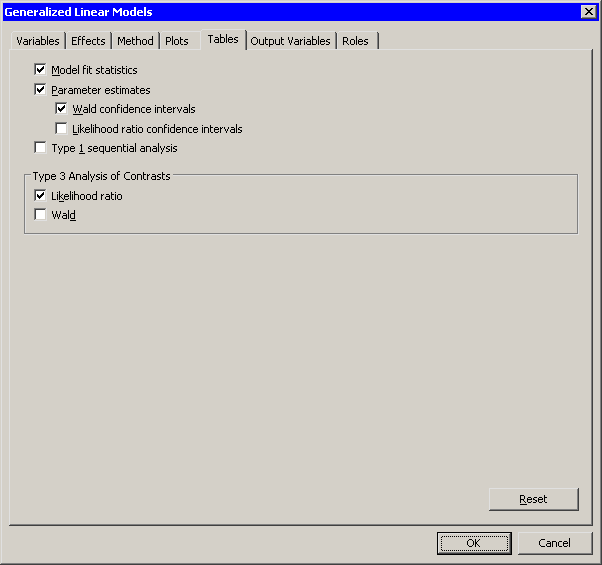
The Tables tab becomes active, as shown in Figure 24.9. This tab controls which tables are produced by the analysis.
By default, the analysis displays Type 3 Wald statistics for the significance of effects. The Wald statistics require less computational time than the Type 3 likelihood ratio statistics, but they can be less accurate. For this example, select the more accurate likelihood ratio statistics.
-
Clear in the Type 3 Analysis of Contrasts group box.
-
Select to request statistics for Type 3 contrasts.
-
Click .
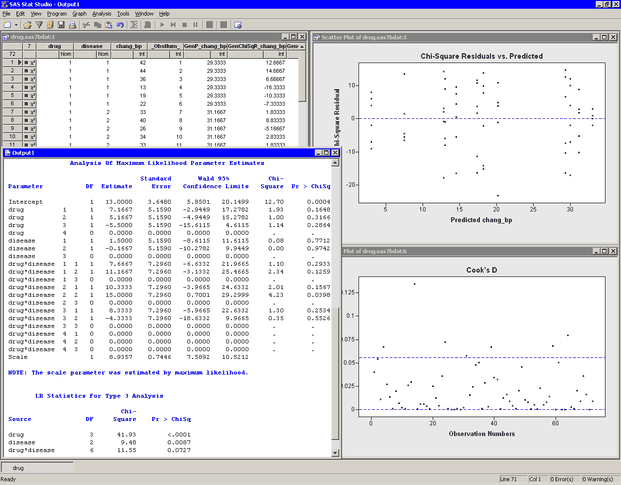
The analysis creates plots, along with output from the GENMOD procedure. Move the plots so that they are arranged as in Figure 24.10.
The tables created by the GENMOD procedure appear in the output window. The "LR Statistics For Type 3 Analysis" table indicates
which effects in the model are significant. The Type 3 chi-square value for an effect tests the contribution due to that effect,
after correcting for the other effects in the model. For example, the chi-square value for the interaction term drug*disease compares the log likelihood for the full model with the log likelihood for the model with only main effects. The value of
the Type 3 likelihood ratio statistic for the interaction term is 11.55. The associated p-value indicates that this term is not significant in predicting the change in blood pressure at the 0.05 significance level.
The main effects for drug and disease are significant.
Since the interaction effect is not significant, the parameter estimates in the "Analysis Of Maximum Likelihood Parameter Estimates" table are not useful. You should rerun the model without the interaction effect before examining the parameter estimates. The next section shows you how to delete the interaction effect and rerun the analysis.