In this section you create a histogram of the latitude variable of the Hurricanes data set. The latitude variable gives the latitude of the center of each tropical cyclone observation.
To create a histogram:
-
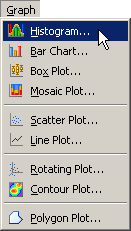
Select → from the main menu, as shown in Figure 5.5.
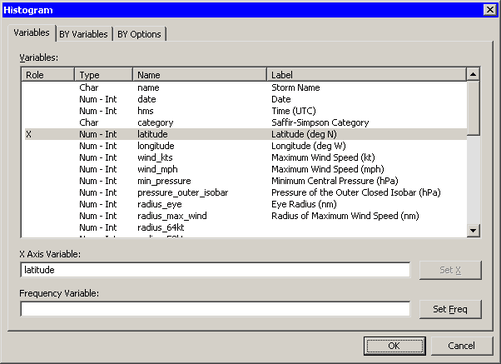
The Histogram dialog box appears. (See Figure 5.6.)
-
Select the
latitudevariable, and click . -
Click .
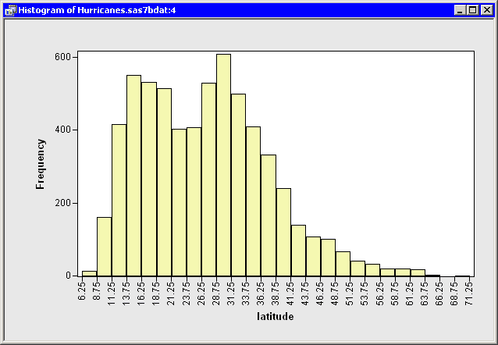
Note: The histogram also supports an optional frequency variable. A histogram appears (Figure 5.7), which shows the distribution of latitudes for the tropical cyclones in this data set. The histogram shows that most Atlantic tropical cyclones occur between 10 and 40 degrees north latitude. The data distribution looks bimodal: one mode near 15 degrees and the other near 30 degrees of latitude.
If a variable has missing values, those values are not included in the histogram.
You can click a histogram bar to select the observations contained in that bin. You can click while holding down the CTRL key to select observations in multiple bins. You can draw a selection rectangle to select observations in contiguous bins.