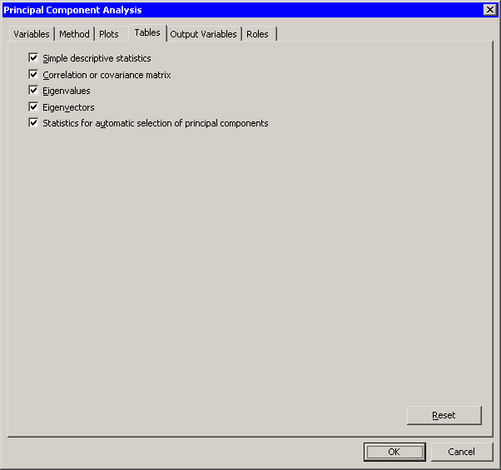
The Tables tab is shown in Figure 26.12. You can use the Tables tab to display the following tables that summarize the results of the analysis:
- Simple descriptive statistics
-
specifies whether to display the mean and standard deviation for each variable.
- Correlation or covariance matrix
-
specifies whether to display the correlation or covariance matrix, as selected on the Method tab.
- Eigenvalues
-
specifies whether to display the eigenvalues of the correlation or covariance matrix, as well as the difference between successive eigenvalues, the proportion of variance explained by each eigenvalue, and the cumulative proportion of variance explained.
- Eigenvectors
-
specifies whether to display the eigenvectors of the correlation or covariance matrix. The eigenvectors are used to form the principal components.
- Statistics for automatic selection of principal components
-
specifies whether to display statistics that indicate how many principal components are needed to represent the
 -dimensional data. This table is displayed only if you request at least as many principal components as there are variables.
A primary use of principal component analysis is to represent ![]() -dimensional data in
-dimensional data in ![]() dimensions. In practice, it is often difficult to determine the best choice for
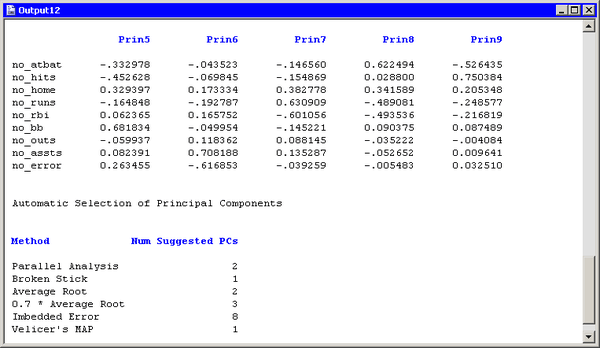
dimensions. In practice, it is often difficult to determine the best choice for ![]() . The “Automatic Selection of Principal Components” table, shown in Figure 26.13, is provided to help you choose
. The “Automatic Selection of Principal Components” table, shown in Figure 26.13, is provided to help you choose ![]() . Numerous papers have been written comparing various methods for choosing
. Numerous papers have been written comparing various methods for choosing ![]() , but no method has shown itself to be superior. The following list briefly describes each method reported in the table. Jackson
(1991, p. 41–51) gives further details.
, but no method has shown itself to be superior. The following list briefly describes each method reported in the table. Jackson
(1991, p. 41–51) gives further details.
- Parallel Analysis
-
generates random data sets with
 observations and variables. The variables are normally distributed and uncorrelated. The method chooses
  to be the largest integer for which the scree plot of the original data lies above the graph of the upper 95 percentiles
of the eigenvalues of the random data.
to be the largest integer for which the scree plot of the original data lies above the graph of the upper 95 percentiles
of the eigenvalues of the random data.
- Broken Stick
-
retains components that explain more variance than would be expected by randomly dividing the variance into
parts.
- Average Root
-
keeps components that explain more variance than the mean of the eigenvalues.
- 0.7 * Average Root
-
keeps components that explain more variance than 0.7 times the mean of the eigenvalues.
- Imbedded Error
-
chooses
to be the value that minimizes a certain function of the eigenvalues.
- Velicer’s MAP
-
chooses
to minimizes a certain function that involves partial correlations. This method is called Velicer’s minimum average partial
(MAP) test or Velicer’s partial correlation procedure.