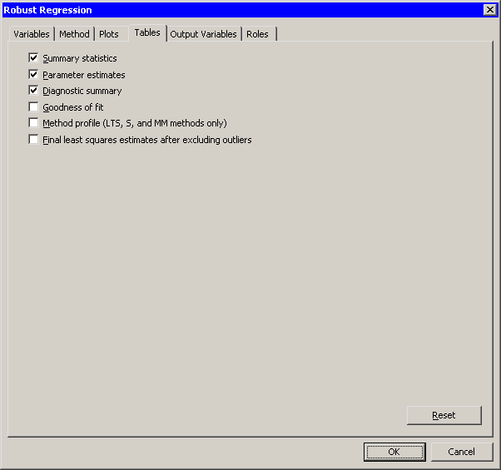
The Tables tab is shown in Figure 22.9. You can use the Tables tab to display the following tables that summarize the results of the analysis:
- Summary statistics
-
displays summary statistics for model variables. The statistics include robust estimates of the location and scale for each variable.
- Parameter estimates
- Diagnostics summary
-
displays a summary of the outlier and leverage diagnostics.
- Goodness of fit
-
displays goodness-of-fit statistics.
- Method profile (LTS, S, and MM methods only)
-
displays a summary of the options used by the method.
- Final least squares estimates after excluding outliers
-
displays least squares estimates computed after deleting the detected outliers. This corresponds to the FWLS option in the PROC ROBUSTREG statement. The parameter estimates reported in this table are the same as the estimates you get if you exclude the outliers reported by ROBUSTREG and then run the REG procedure on the remaining observations.