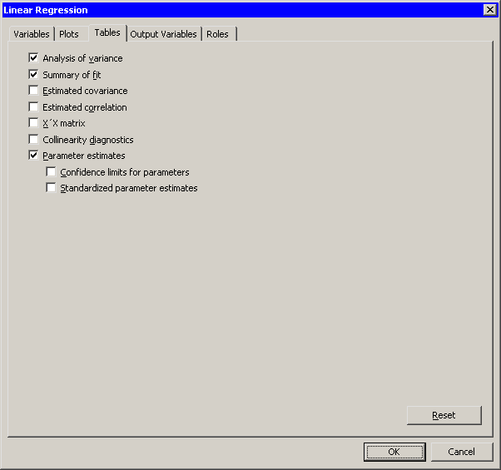
The Tables tab is shown in Figure 21.8. You can use the Tables tab to display the following tables that summarize the results of the analysis:
- Analysis of variance
- Summary of fit
-
displays a table of model fit statistics.
- Estimated covariance
-
displays the covariance of the parameter estimates.
- Estimated correlation
-
displays the correlation of the parameter estimates.
- X’X matrix
-
displays the X’X crossproducts matrix for the model. The crossproducts matrix is bordered by the X’Y and Y’Y matrices.
- Collinearity diagnostics
-
displays a detailed analysis of collinearity among the regressors.
- Parameter estimates