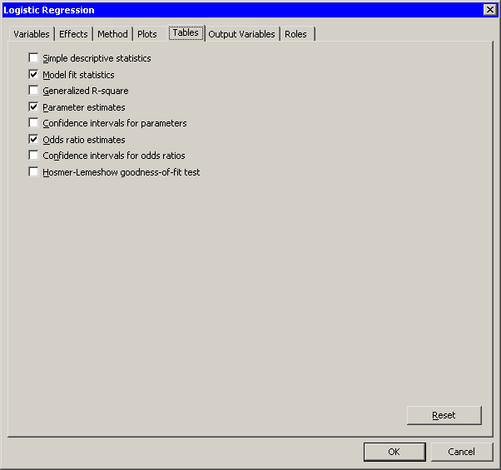
The Tables tab is shown in Figure 23.12. You can use the Tables tab to display the following tables that summarize the results of the analysis:
- Simple descriptive statistics
-
displays a table of summary statistics for the explanatory variables.
- Model fit statistics
-
displays a table of model fit statistics.
- Generalized R-square
-
displays generalized R-square statistics.
- Parameter estimates
-
displays estimates for the model parameters.
- Confidence intervals for parameters
-
displays estimates of 95% confidence intervals for the model parameters.
- Odds ratios estimates
-
displays the odds ratio estimates.
- Confidence intervals for odds ratios
-
displays estimates of 95% confidence intervals for the odds ratios.
- Hosmer-Lemeshow goodness-of-fit test
-
displays partition information and statistics for the Hosmer-Lemeshow goodness-of-fit test.