In this example, you generate descriptive statistics for the pressure_outer_isobar variable of the Hurricanes data set. The Hurricanes data set contains 6,188 observations of tropical cyclones in the Atlantic basin. The pressure_outer_isobar variable gives the sea-level atmospheric pressure for the outermost closed isobar of a cyclone. This is a measure of the
atmospheric pressure at the outermost edge of the storm.
To create descriptive statistics:
-
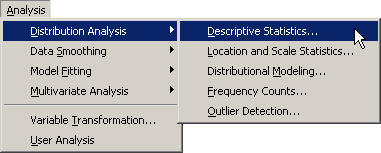
Select → → from the main menu, as shown in Figure 13.1.
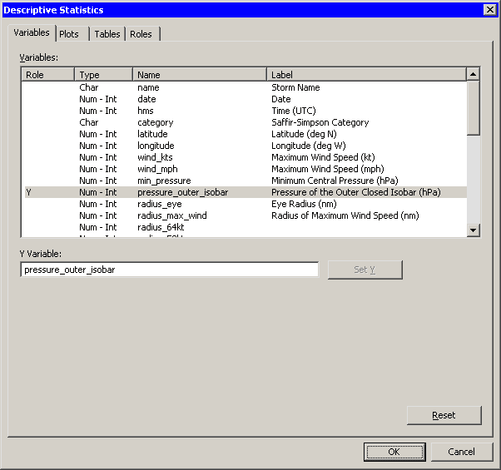
The Descriptive Statistics dialog box appears. (See Figure 13.2.) You can select a variable for the univariate analysis by using the Variables tab.
-
Select the variable
pressure_outer_isobar, and click . -
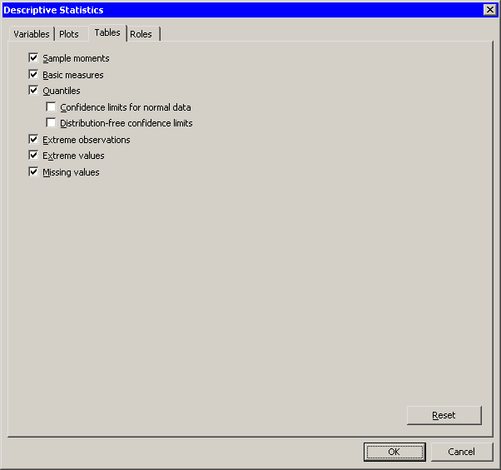
Click the Tables tab.
The Tables tab becomes active. (See Figure 13.3.)
-
Select .
-
Select .
-
Click .
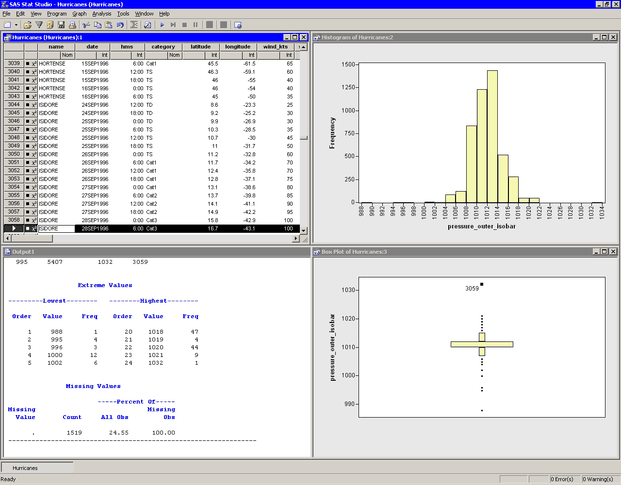
The analysis calls the UNIVARIATE procedure, which uses the options specified in the dialog box. The procedure displays tables in the output document, as shown in Figure 13.4. In addition to displaying basic statistics such as the mean, median, and standard deviation, the tables also display a few extreme values that seem incongruous. The “Extreme Values” table shows that there is one low value (998) and one high value (1032) that require investigation. The “Missing Values” table reveals that almost 25% of the values for this variable are missing.
Two plots are created. One plot shows a histogram of the selected variable; the other shows a box plot. One plot might be hidden beneath the other.
For the
pressure_outer_isobarvariable, the box plot and the “Extreme Values” table reveal many outliers. It is often useful to investigate outliers to determine whether they are spurious or miscoded data, or to better understand the extreme limits of the data. -
In the box plot, click the outlier with the highest value of
pressure_outer_isobar.This selects the observation in all views of the data, including the data table. You can use the F3 key to scroll through the data table to the next selected observations.
-
Activate the data table by clicking the title bar. Use the F3 key to scroll the selected observation into view.
The selected observation corresponds to Hurricane Isadore, September 28, 1996. Scrolling through the data table reveals that the observations before and after the selected observation had a value of 1012 hPa for
pressure_outer_isobar. This might indicate that the outlier value of 1032 hPa is a misrecorded value.You can examine other outliers similarly.
-
In the box plot, click the outlier with the lowest value of
pressure_outer_isobar. -
Activate the data table by clicking its title bar. Use the F3 key to scroll the selected observation into view.
This selected observation corresponds to a pressure of 988 hPa for the outermost closed isobar of Hurricane Hugo, September 23, 1989. The data table shows that the observations before the selected observation had considerably larger values of
pressure_outer_isobar. Furthermore, the value ofmin_pressurefor the selected observation is 990 hPa, which is larger than the value being investigated. This violates the fact that for a low pressure system, the minimum central pressure should be less than the pressure of the outermost closed isobar. Therefore, the 988 hPa value is most likely misrecorded.You can exclude misrecorded observations by using the and features of the data table. For details, see Chapter 4: Interacting with the Data Table. Excluding an observation affects all variables. You can also exclude a single misrecorded value by doing the following: replace the erroneous value with a missing value by typing “.” (or “ ” for a character variable) into the data table cell. Save the data if you want to make the change permanent.