You can create your own custom analyses by writing an IMLPlus program. An introduction to IMLPlus programming is described in SAS/IML Studio for SAS/STAT Users and in the SAS/IML Studio online Help. You can display the online Help by selecting → from the main menu.
When you select → from the main menu, SAS/IML Studio calls a module called UserAnalysis. SAS/IML Studio distributes a sample UserAnalysis module as an example of the sort of analyses that you can write. You can copy and modify the UserAnalysis module to execute your own IMLPlus programs.
To run the sample UserAnalysis module:
-
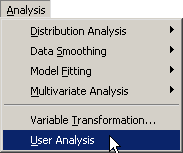
Select → from the main menu, as shown in Figure 33.1.
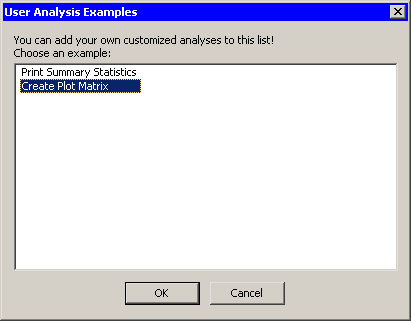
The sample UserAnalysis module displays a simple dialog box that contains a list of analyses that you can run on the data. (See Figure 33.2.) The dialog box displays a list of two analyses.
-
Select and click .
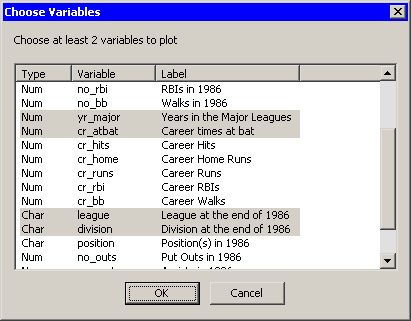
The analysis demonstrates one way to query information from the person that is running the analysis. In this case, the program prompts you to select several variables to plot. If you select
 variables from this list, the variables will be plotted against each other in an
  lower-triangular array of plots of the pairwise combination of variables.
-
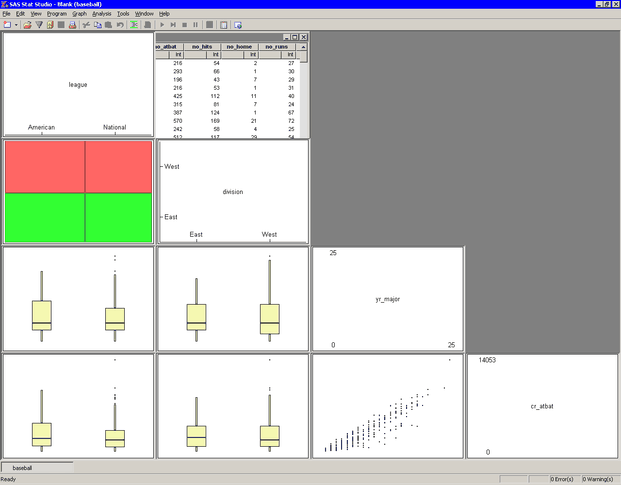
Hold down the CTRL key and select
yr_major,cr_atbat,league, anddivision, as shown in Figure 33.3. Click .These four variables are plotted in pairwise combinations, as shown in Figure 33.4. Three different plots are created. Mosaic plots display the relationship between pairs of nominal variables. Box plots are used to plot an interval variable against a nominal variable. Scatter plots display the relationship between pairs of interval variables. Windows along the diagonal display variable names and values of each axis.