| Scatter Plots of Selected Variables |
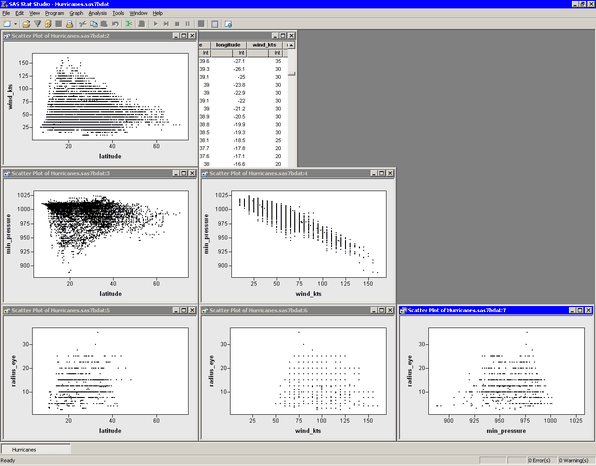
If one or more variables are selected in a data table when you select Graph  Scatter Plot, then the Scatter Plot dialog box does not appear. Instead, a scatter plot matrix is created that shows each pair of the selected variables. (See Figure 6.10.)
If you create a matrix of plots from selected variables, you can close the matrix by pressing the F11 key while any plot is active and selecting from the pop-up menu. Alternatively, you can use the Workspace Explorer to quickly close plots. (See the section Workspace Explorer.)
Variables with a Frequency or Weight role are ignored when you are creating scatter plots.
Figure 6.10
A Matrix of Scatter Plots