| Interactive Histogram Binning |
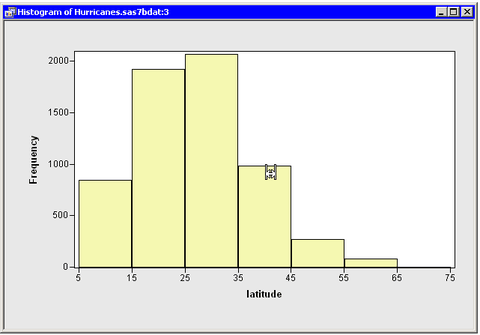
Sometimes it is useful to explore how the shape of a histogram varies with different combinations of anchor locations and bin widths. Interactively changing the histogram can help you determine whether apparent modes in the data are real or are an artifact of a specific binning.
To interactively change the anchor location and bin width, right-click in the middle of the histogram and select Bin Tool from the pop-up menu, as shown in Figure 5.12.
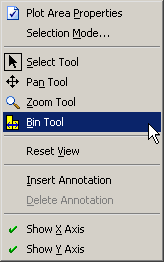
The mouse pointer changes its shape, as shown in Figure 5.13. If you drag the pointer around in the plot area, then the histogram rebins. Dragging the pointer horizontally changes the anchor position. Dragging the pointer vertically changes the bin width. When the pointer is near the top of the plot area, the bin widths are relatively small; when the pointer is near the bottom, the bin widths are larger.