Data Table Menus
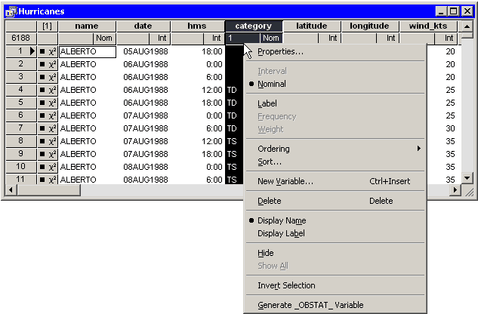
The first two rows of the data table are column headings (also called variable headings). The first row displays the variable’s name or label. The second row indicates the variable’s measure level (nominal or interval), the default role the variable plays, and, if the variable is selected, in what order it was selected. Subsequent rows contain observations.
The first two columns of the data table are row headings (also called observation headings). The first column displays the observation number (or some other label variable). The second column indicates whether the observation is included in plots and analyses.
The effect of selecting a cell of the data table depends on the location of the cell. To select a variable, click the column heading. To select an observation, click the row heading.
You can display a context menu as in Figure 4.1 by right-clicking a column heading or row heading. A context menu means that you see different menus depending on where the mouse pointer is when you right-click. For the data table, the Variables menu differs from the Observations menu.