Changing the Color and Shape of Observation Markers
Color Markers to Represent Values of a Nominal Variable
You might also find it useful to color observation markers according to the value of a nominal (that is, discrete) variable. This enables you to visually identify specific categories of the coloration variable, provided that the variable has a small number of categories.
You can use the ColorCodeObsByGroups module to color observation markers according to the value of a nominal variable. One of the arguments to the ColorCodeObsByGroups module is a vector of colors (a color map or color ramp) that has the same number of colors as the number of unique categories in the nominal coloration variable.
If the coloration variable is a character variable, then color coding corresponds to an alphabetical ordering of the values of the variable. The first color corresponds to the first sorted value; the last color corresponds to the last sorted value. If the coloration variable is a numeric nominal variable, then color coding corresponds to a numeric ordering of the values of the variable. Missing values appear first in the sorted order for all variables.
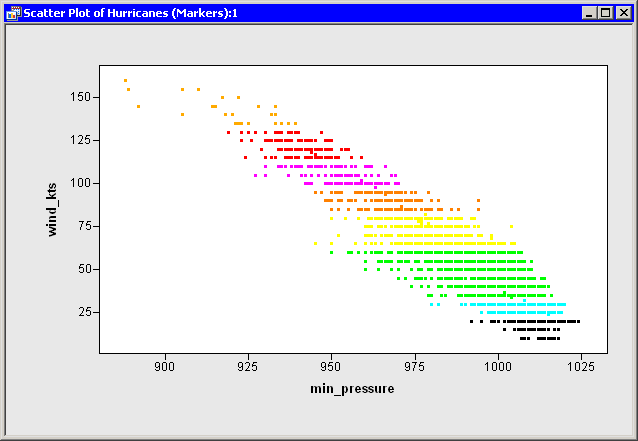
For example, in the Hurricanes data set, you might want to color observations by using the category variable that contains the Saffir-Simpson intensity of the cyclone as given in Table 9.1. Add the following statements at the bottom of the program window, and select → from the main menu. The resulting plot is shown in Figure 10.2.
   /* color markers by value of a nominal variable */
   /*        missing  Cat1   Cat2    Cat3    Cat4  Cat5    TD    TS */
   ColorMap = BLACK//YELLOW//ORANGE//MAGENTA//RED//GOLD//CYAN//GREEN;
   run ColorCodeObsByGroups( dobj, "category", ColorMap );
Figure 10.2: Markers Colored by a Nominal Variable