Adding Curves to Graphs
Draw a Reference Line
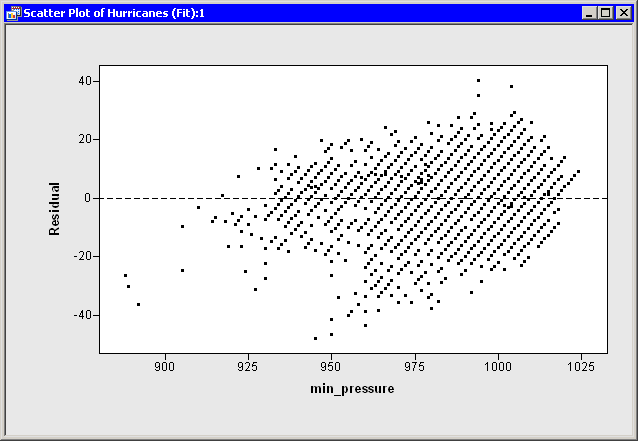
You can create a residual plot of the residuals versus the explanatory variable as before. However, this time you add a horizontal reference line to the plot to indicate where residuals are zero.
By default, curves are drawn on top of observations, which is fine for this example. The following statements draw a dashed
black line at  .
.
Add the following statements at the bottom of the program window, and select → from the main menu.
   declare ScatterPlot ResPlot;
   ResPlot = ScatterPlot.Create( dobj, "min_pressure", "Residual" );
   ResPlot.DrawUseDataCoordinates();
   ResPlot.DrawSetPenStyle( DASHED );
   ResPlot.DrawLine( 850, 0, 1150, 0 ); /* from (850,0) to (1150,0) */
The DrawUseDataCoordinates method is a method in the Plot class. The ScatterPlot class can use all the methods in the Plot class. (Formally, the Plot class is a base class for the ScatterPlot class.) The DrawUseDataCoordinates method specifies that the coordinate system for the reference line is the same as the coordinate system for the plot’s data.
If you do not specify otherwise, a curve in a plot is drawn as a solid black line with a one-pixel width. The DrawSetPenStyle method specifies that you want to override the default line style (SOLID) with a different style (DASHED).
The DrawLine method
specifies the two endpoints of the line segment. In this example, a line is drawn on the plot from  to
to  . The line extends across the entire plot area since both endpoints are beyond the range of the
 min_pressure variable. Figure 6.1 shows the resulting plot.
Figure 6.1: A Plot with a Reference Line