You can now select observations in either graph and see how the latitude of Atlantic cyclones is related to the wind speed and minimum pressure. You can select observations in a plot by clicking on observations or on bars. You can add to a set of selected observations by holding the CTRL key and clicking. You can also select observations by using a selection rectangle. To create a selection rectangle, click in a graph and hold down the left mouse button while you move the mouse pointer to a new location.
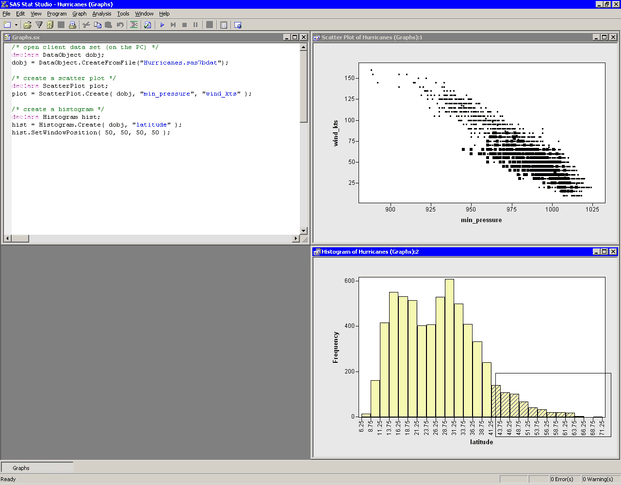
In the scatter plot, use a selection rectangle to select all observations with wind speed greater than or equal to 100 knots. The result is shown in Figure 3.1.
Note that these very intense storms tend to occur in southern latitudes, primarily between 14 and 35 degrees of latitude.
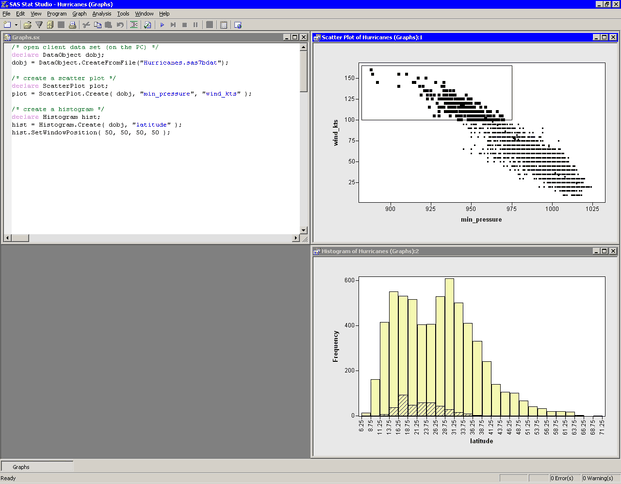
In the histogram, use a selection rectangle to select all observations with latitude greater than 41 degrees. The result is shown in Figure 3.2.
The National Hurricane Center classifies a cyclone as a hurricane if it has sustained low-level winds of 64 knots or greater. Note that few of the storms that enter northern latitudes are still strong enough to be classified as hurricanes. Northern storms tend to have relatively low wind speeds.