Viewing a SAS Report

A SAS report is a report 
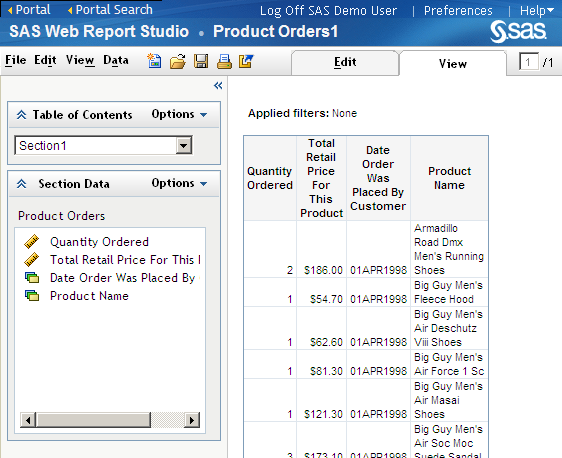
that has been created using SAS Web Report Studio and is stored in an established SAS format (SAS Report Model format). Reports can contain a graph, a table, or both. Depending on the software that is installed, the portal uses either SAS Web Report Studio or SAS Web Report Viewer to display reports.
Here is a sample report:
SAS Report
You can perform the following tasks with SAS reports:
  • If the report opens in SAS Web Report Studio, then you can edit the report. For example, you can apply filters, change the header, and select different data items. You can also insert new objects, such as tables, graphs, and text. For detailed instructions, click Help in the banner to access Help topics for SAS Web Report Studio.
  • If the report opens in SAS Web Report Viewer, then the report is read-only. You can perform basic operations such as drilling down and expanding a report. You can also refresh the data that appears in the report. These actions apply to the current session only and are not preserved with the report.
  • You can print and export the graph.
  • If you add a report to your Bookmarks portlet, you can then e-mail the report from the portlet. (If the report opens in SAS Web Report Studio, then you can e-mail the report directly from within the SAS Web Report Studio application.)
You can also display SAS reports by using the Report Portlet. The Report Portlet provides a static view of a SAS report.