Performance Tools
Why Use a Performance Monitor?
Windows
performance monitors are useful for tuning and diagnosing problems
in your application or computer system. The monitors include System
Monitor under Windows XP, Windows Vista, Windows 7, Windows Server
2008, and Windows Server 2003. By correlating the information from
SAS counters with other operating environment counters, you can more
easily troubleshoot performance problems.
For example, suppose
that your SAS job appears not to be running. Perhaps the job is performing
a long and complicated DATA step that generates a very large data
set on a network drive. You can be certain that the job is still running
by monitoring the Disk WriteFile Bytes Written/Sec and Disk WriteFile
Bytes Written Total counters.
Starting the Windows Performance Monitors
When you type
perfmon in the Run dialog box, you open the Performance window when you use Windows Vista, Windows
7, Windows Server 2008, Windows Server 2003, and Windows XP.
You can also access
the Performance Monitor and the Performance window from the Administrative Tools folder.
Note: If you want to use the performance
counters for 32-bit versions of SAS on Windows x64 system, invoke
the 32-bit version of PerfMon after the 32-bit versions of SAS has
been invoked. To invoke the 32-bit version of PerfMon, access Windows
Explorer and open the folder:
c:\Windows\SysWOW64 that contains the 32-bit applications. In this folder, you will
see the 32-bit version of PerfMon. You can access the 32-bit versions
of SAS performance counters.
Performance Counters and Objects
A counter
is a piece of information that the system monitors. Performance objects
represent individual processes, sections of shared memory, and physical
devices, such as Memory and LogicalDisk. Counters are grouped by objects.
For example, the Memory object contains counters such as Available
Bytes, Committed Bytes, and Page Faults per sec. The Processor object
has counters such as %Processor Time and %User Time.
By observing various
system counters and application-defined counters, you can determine
performance problems. You can search for problems in your system and
isolate them to areas such as hardware, system software, or your application.
For more information about the System Monitor, see the Windows XP
Resource Kit.
SAS Counters in the Performance and System Monitors
SAS includes the
following application-defined counters in the SAS object:
specifies the number
of times per second that SAS successfully calls the SetFilePointer()
API on disk files.
Selecting SAS Counters to Monitor
The performance monitor
immediately collects and displays information about the counters that
you selected.
Multiple SAS counters
can be monitored. You can see multiple instances monitored, where
each instance is a separate SAS process. SAS instances are listed
in the form SAS PID number.
The PID number is the process identifier of the SAS session. You can
see a list of all processes by using the Task Manager.
Examining the Performance between the DATA and PROC SORT Steps
To see the difference in performance
between the DATA step and the PROC step, submit this code:
options fullstimer;
  /* Create a test data set with some random data. */
DATA a (drop=s);
   do i = 1 to 500000;
      x = ranuni(i);
      y = x*2;
      z = exp(x*y);
      output;
   end;
   /* The sleep helps to delineate the subsequent  */
   /* sort in the Performance Monitor graph        */
   s = sleep(15);
run;
PROC sort data = a noduplicates;
   by z y x i;
run;
After you submit this
code, the Performance Monitor or System Monitor will generate results
similar to those results in Performance of the DATA Step and the PROC SORT Step. You might have to adjust the scale factor of the different
counters.
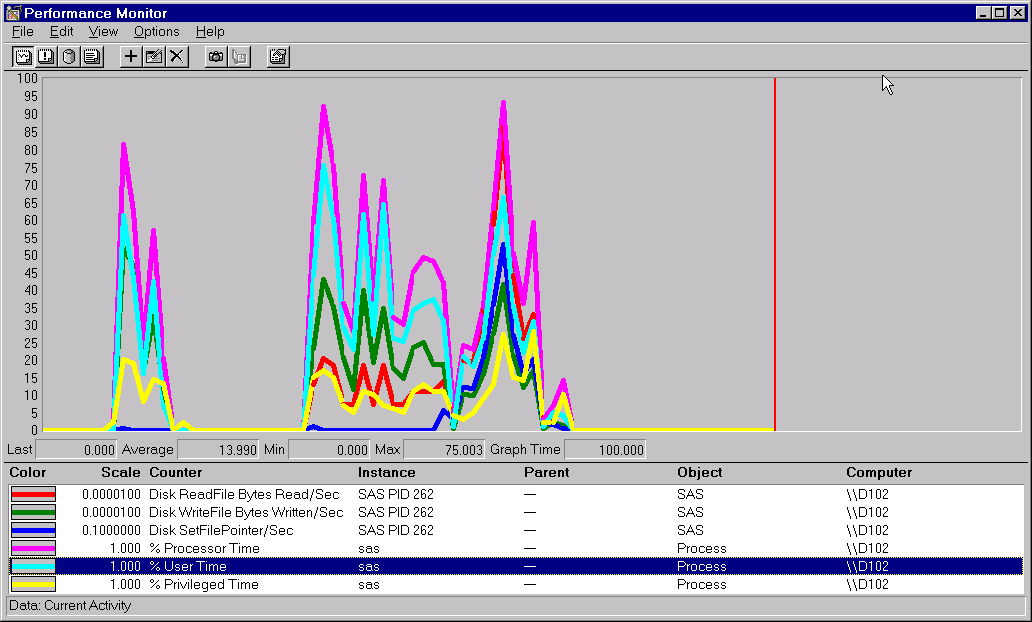
The DATA step in the
display shows that there is very little activity from Disk ReadFile
Bytes Read/Sec or Disk SetFilePointer/Sec. Notice that in the subsequent
PROC SORT output there is much more activity from these two counters.
The output indicates that the data set is being read (Disk Readfile
Bytes Read/Sec) in order to be sorted, and that a certain amount of
random I/O is performed by the sort (Disk SetFilePointer/Sec).
Examining a PROC SQL Query
-
Submit the code in Step 1 and Step 2. Step 2 creates an index.
/* Step 1 */ /* Create a test data set with some random data. */ /* Do this twice - once with Step 2 and once */ /* without Step 2. */ libname sample 'c:\'; DATA sample.a; do i = 1 to 500000; x = ranuni(i); y = x*ranuni(i); z = exp(y); output; end; run; /* Step 2 */ /* Create a simple index on variable x. */ /* Submit this step once. */ PROC DATASETS library = sample; modify a; index create x; quit; -
Submit the code in Step 3 to see a graph such as Performance of PROC SQL Query with an Index .
      /* Step 3                                        */
   /* Perform a query on the data.  Do this twice - */
   /* once with an index and once without an index  */
   /* The query should select about 50% of the      */
   /* observations in the data set.                 */

PROC SQL;
   create table sample.yz as
   select y,z
      from sample.a
      where x > 0.5;
   quit;
-
Resubmit Step 3 to see a graph such as Performance of PROC SQL Query without an Index.
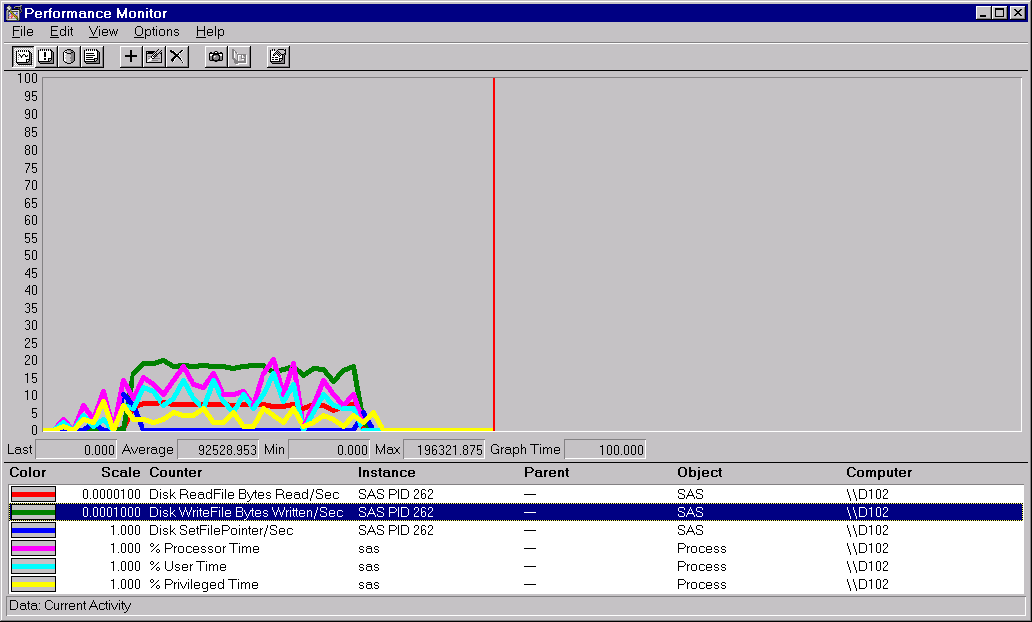
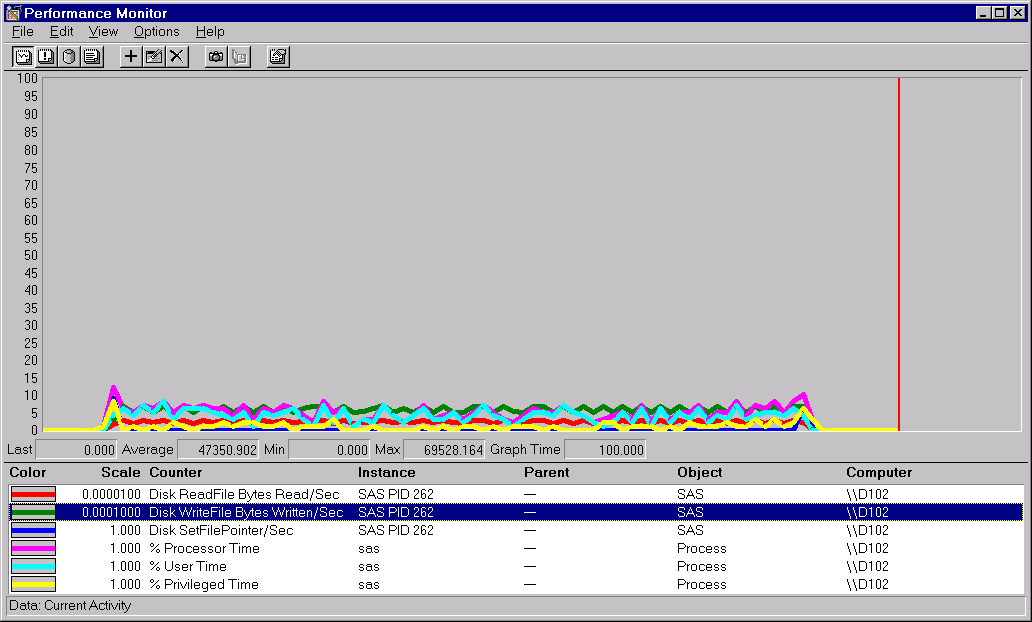
In Performance of PROC SQL Query without an Index, the counters averaged under 10% on the scale, whereas
in Performance of PROC SQL Query with an Index, several of the counters averaged more than 10%, and the
Disk WriteFile Bytes Written/Sec counter rose more than 25%. A higher
value for these counters implies good overall throughput for the operation.
Note that to make a
valid comparison with the Performance Monitor graph or with the System
Monitor graph, you must ensure that the counters are using the same
scale. You can confirm the counters by observing the absolute values.
The Average value for Disk WriteFile Bytes Written/Sec in Performance of PROC SQL Query with an Index was 92528.953. Contrast this value with the same counter
in Performance of PROC SQL Query without an Index, in which the Average value was 47350.902. For this operation,
bytes were written almost twice as fast when the data set was indexed.