The LAYOUT OVERLAYEQUATED Statement
Several SAS procedures
create plots where the X and Y axes are scaled in the same units.
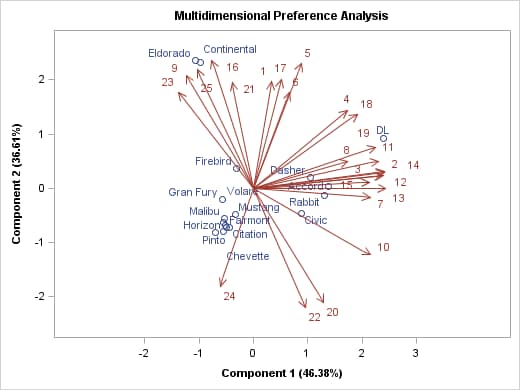
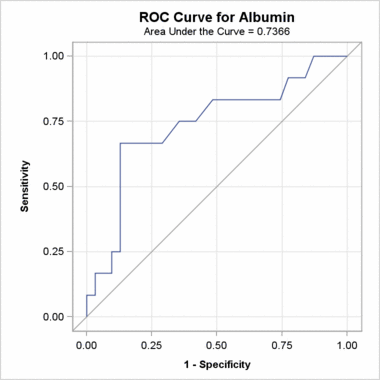
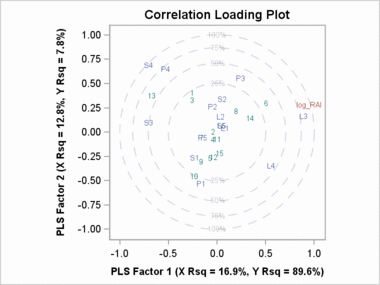
Here are some samples of such plots taken from the Examples section
of the procedure documentation.
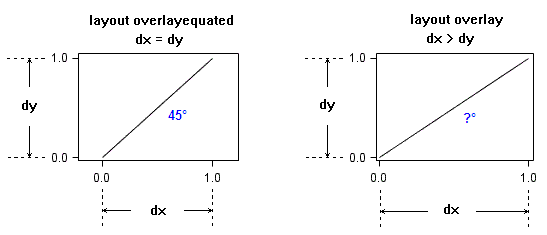
Whenever the same units of measure
are used on both axes, it is desirable that the distance displayed
between the same data interval be the same on both axes. To achieve
this effect, you must use an OVERLAYEQUATED layout.
For specifying plot statements,
the OVERLAYEQUATED layout is similar to the OVERLAY layout: you can
specify one or more 2-D plot statements within the layout block. However,
OVERLAYEQUATED imposes a restriction on the plot axes and differs
from OVERLAY in several ways. With OVERLAYEQUATED,
-
The slope of a line in the display is the same as the slope in the data. In other words, a 45° slope in data will be represented by a 45° slope in the display. The EQUATETYPE= option offers different ways of presenting the data ranges while preserving the 45° display slope (see Types of Equated Axes).