Specifying Axis Options
To set axis options
on the LAYOUT OVERLAY statement, you use the following syntax. Notice
that each axis has its own separate set of options, and that the option
specifications must be enclosed in parentheses. GTL frequently uses
parentheses to bundle options that modify a specific feature. These
are called "option bundles."
layout overlay / xaxisopts =(options) yaxisopts =(options)
  x2axisopts=(options) y2axisopts=(options);
If you specify the X2AXISOPTS=
or Y2AXISOPTS= options but there is no data mapped to these axes,
the option bundles are ignored.
One of the basic options that you can set for any axis
is DISPLAY= keyword | ( feature-list ). Four features are available
for the feature-list: LINE,
TICKS, TICKVALUES, and LABEL. The keywords STANDARD and ALL are equivalent
to specifying the full list: ( LINE TICKS TICKVALUES LABEL ). You
can also use DISPLAY=NONE to completely suppress all parts of the
axis.
Example: Some plots do not need TICKS on all axes. The follow axis option
eliminates the ticks on the X axis by omitting the TICKS value on
the feature-list.
layout overlay / xaxisopts=( display=( line label tickvalues )  );
  barchartparm x=city y=fahrenheit;
endlayout;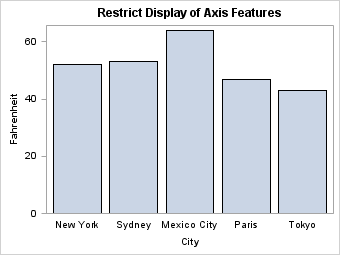
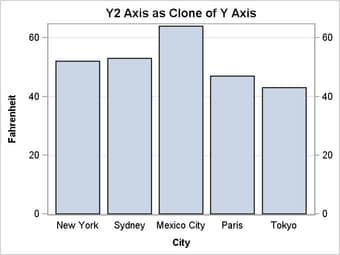
We now return to the common situation where you want
a duplicated Y2 axis. Here is the most efficient way to do it:
layout overlay / yaxisopts=( displaysecondary=standard );
  barchartparm x=city y=fahrenheit;
endlayout;
This specification creates the Y2
axis as a duplicate of the Y axis: all features are displayed without
having to map data to the Y2 axis. You can also restrict the secondary
axis features that are displayed by specifying a list of the features
that you want to be displayed. The values available for the DISPLAYSECONDARY=
option are the same as those of the DISPLAY= option. The following
example specifies that the secondary axis label is not to be displayed.
It also requests that grid lines be displayed on the Y axis: