Using Sidebars
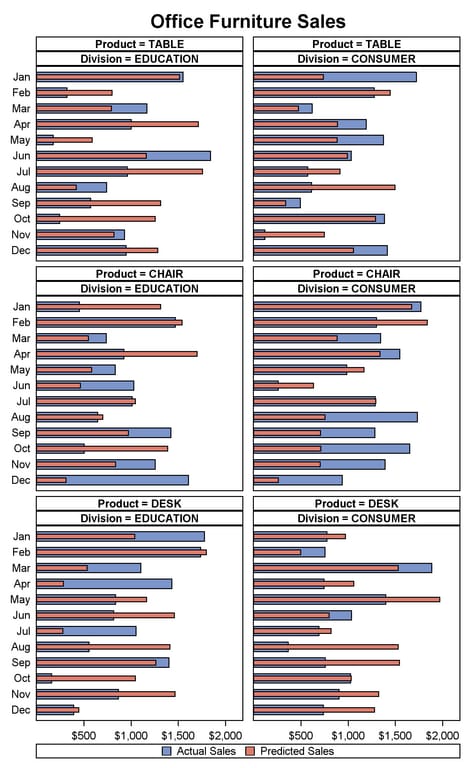
Sidebars
are useful for aligning information outside of the grid. In the following
example, a sidebar is used to display a graph title, rather than using
an ENTRYTITLE statement. The advantage of using sidebars for title
and footnote information is that a sidebar is always horizontally
aligned on the grid itself, not on the complete graph width. Of course,
you have to specify the title text on an ENTRY statement, and then
set the appropriate text properties (TEXTATTRS= option), alignment
(HALIGN= option), and padding (PAD= option). Compare the default
centering of the "title" in this example with similar examples in
this chapter that specify a title with the ENTRYTITLE statement.
This example
also uses a sidebar to display a legend. A legend can be placed in
any of the TOP, BOTTOM, RIGHT, or LEFT sidebars. The legend's alignment
is based on the grid size, not the graph size.
proc template;
 define statgraph sidebar;
   begingraph / designwidth=490px designheight=800px border=false;

     layout datapanel classvars=(product division) / columns=2
         columngutter=10  rowgutter=5
         headerlabelattrs=GraphLabelText(weight=bold)
         rowaxisopts=(display=(tickvalues))
         columnaxisopts=(display=(ticks tickvalues)
           offsetmin=0
           linearopts=(tickvalueformat=dollar6. viewmax=2000
           tickvaluelist=(500 1000 1500 2000)));
       sidebar / align=top;
         entry "Office Furniture Sales" /
           textattrs=GraphTitleText(size=14pt) pad=(bottom=5px);
       endsidebar;
       sidebar / align=bottom;
         discretelegend "actual" "predict";
       endsidebar;

       layout prototype;
         barchart x=month y=actual  /
           orient=horizontal fillattrs=GraphData1
             barwidth=.6 name="actual";
         barchart x=month y=predict /
           orient=horizontal fillattrs=GraphData2
             barwidth=.3 name="predict";
       endlayout;
     endlayout;
   endgraph;
 end;
run;


proc sgrender data=sashelp.prdsale template=sidebar;
   where country="U.S.A." and region="EAST" and
         product in ("CHAIR" "DESK" "TABLE");
run;
