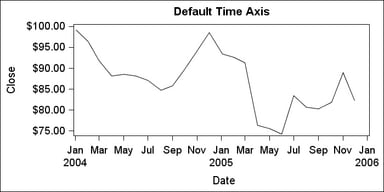
TIME Axes

Overview

TIME axes are numeric axes that display SAS date or time values in an intelligent way. Such axes are created whenever the primary plot has a SAS date, time, or datetime format associated with a column that is mapped to an axis. In the following example, the DATE variable has a SAS date format associated with it. By default, the TIME axis decides an appropriate 
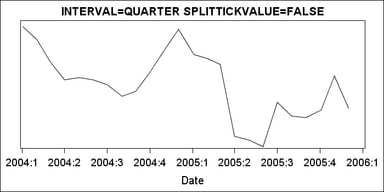
tick value format and an interval to display. Notice that, in the default case, when the X or X2 axis is a TIME axis, the space that is used for the tick values is conserved by splitting the values at appropriate date or time intervals and extracting larger intervals. In this example, the column format for the DATE variable could be MMDDYY or any other date-type format. The actual format serves only as a hint and is not used directly, unless requested.
layout overlay; 
  seriesplot x=date y=close;
endlayout;
Default Time Axis
Note: In this example, the data range for DATE was from 1Jan2004 to 1Dec2005. The TIME axis chose the interval of MONTH to display tick values. Had the data range been larger, say 1Jan1998 to 1Dec2005, the TIME axis would choose a larger interval, YEAR, to display by default.

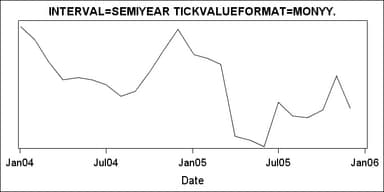
Setting the Tick Values

Using the INTERVAL= option, you can select different date or time intervals to display. The default interval is AUTO, which chooses an appropriate interval, based on the data and the column format.
Value on INTERVAL=
Unit
Tick Interval
Default Tick Value Format
AUTO
DATE, TIME, or DATETIME
automatically chosen
SECOND
TIME or DATETIME
second
TIME8.
MINUTE
TIME or DATETIME
minute
TIME8.
HOUR
TIME or DATETIME
hour
TIME8.
DAY
DATE or DATETIME
day
TIME9.
TENDAY
DATE or DATETIME
ten days
TIME9.
WEEK
DATE or DATETIME
seven days
TIME9.
SEMIMONTH
DATE or DATETIME
1st and 16th of each month
TIME9.
MONTH
DATE or DATETIME
month
MONYY7.
QUARTER
DATE or DATETIME
three months
YYQC6.
SEMIYEAR
DATE or DATETIME
six months
MONYY7.
YEAR
DATE or DATETIME
year
YEAR4.
The following example specifies that tick values should occur at quarter intervals:
layout overlay / xaxisopts=( timeopts=(interval=quarter) );
Axis with INTERVAL=QUARTER
You can turn off the splitting feature with the SPLITTICKVALUE=FALSE option. Notice that each tick value uses more space.
layout overlay / xaxisopts=(timeopts=(interval=quarter
                                      splittickvalue=false ));
Axis with SPLITTICKVALUE=FALSE

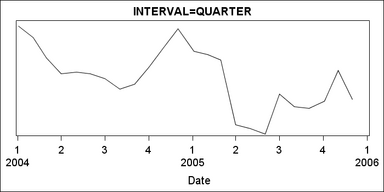
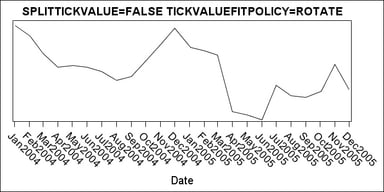
Formatting Axis Tick Values

As with LINEAR axes, you can force a specific format for tick values with the TICKVALUEFORMAT= option, which also turns off the tick splitting feature. If you specify TICKVALUEFORMAT=DATA, the format is associated with the column that is used. Or you can specify a format:
layout overlay / xaxisopts=(timeopts=(interval=semiyear
                                      tickvalueformat=monyy. ));
Axis with TICKVALUEFORMAT= Option

Avoiding Tick Value Collisions

As with LINEAR axes, you can specify a tick value fitting policy for a TIME axis. The following policies are available: THIN, ROTATE, STAGGER, ROTATETHIN, STAGGERTHIN, and STAGGERROTATE when tick values are not split. The default policy is THIN .
layout overlay / xaxisopts=(timeopts=(interval=month 
                                      splittickvalue=false
                                      tickvaluefitpolicy=rotate ));
Axis with TICKVALUEFITPOLICY=ROTATE

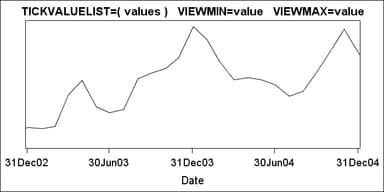
Setting the Axis Data Range

As with LINEAR axes, you can force specific tick values to be displayed with the TICKVALUELIST= option. The VIEWMIN= and VIEWMAX= options control the data range of the axis. If you specify TICKVALUEFORMAT=DATA, the format that is associated with the column is used.
layout overlay / xaxisopts=(timeopts=( tickvalueformat=data
  viewmin="31Dec2002"d viewmax="31Dec2004"d
  tickvaluelist=("31Dec2002"d "30Jun2003"d
                 "31Dec2003"d "30Jun2004"d "31Dec2004"d) ));
Axis with TICKVALUELIST=, VIEWMIN=, and VIEWMAX=