Using Options on Text Statements
Options Available on All Text Statements
The ENTRYTITLE,
ENTRYFOOTNOTE, and ENTRY text statements provide options that apply
to all of the text-items that
form the text string (unlike the prefix options, which can be applied
to pieces of the text).
TEXT-STATEMENT text-item <...<text-item>> / <options>;
Setting Text Background, Borders, and Padding
By default,
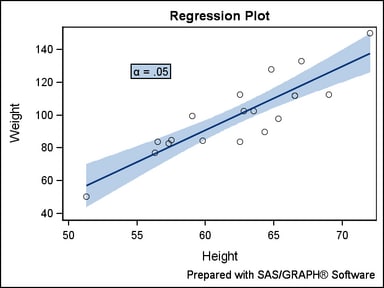
the background of all text is transparent. To specify a background
color, you must specify OPAQUE=TRUE to turn off transparency, which
then enables you to specify a background color. In the following example,
the fill color of the band is specified for the background of the
entry text. A border is also added.
begingraph; entrytitle "Regression Plot"; entryfootnote halign=right "Prepared withSAS/GRAPH " {unicode "00AE"x} " Software" / textattrs=(size=9pt); layout overlay; modelband "clm"; scatterplot x=height y=weight; regressionplot x=height y=weight / clm="clm" alpha=.05; entry {unicode alpha} " = .05" / autoalign=auto border=true opaque=true backgroundcolor=GraphConfidence:color ; endlayout; endgraph;
Notice that extra space appears between the entry border
and the text. This space is called padding and can be set with the
PAD= option. The default padding is
ENTRY "string" / PAD=(LEFT=3px RIGHT=3px TOP=0 BOTTOM=0) border=true;You can
set the padding individually for the LEFT, RIGHT, TOP, and BOTTOM
directions, or you can set the same padding in all directions as follows:
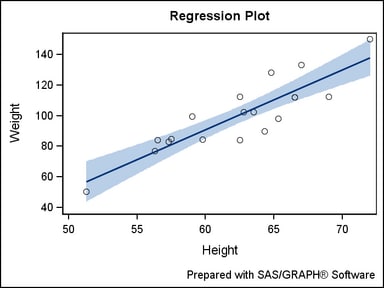
ENTRY "string" / PAD=5px border=true;Padding
is especially useful when you want to add extra space between titles,
or add space between the last title (or first footnote) and the plot
area in the graph:
begingraph; entrytitle "Regression Plot" / pad=(bottom=10px) ; entryfootnote halign=right "Prepared withSAS/GRAPH " {unicode "00AE"x} " Software" / textattrs=(size=9pt) pad=(top=10px) ; layout overlay; modelband "clm"; scatterplot x=height y=weight; regressionplot x=height y=weight / clm="clm" alpha=.05; endlayout; endgraph;
Managing Long Text in Titles and Footnotes
When you
change the size of a graph, the size of all fonts in the graph is
scaled up or down by default. However, when the graph size is reduced,
even font scaling has limits on what it can do with long text strings
that are specified on ENTRYTITLE or ENTRYFOOTNOTE statements. The
following statement options are available to deal with this situation:
TEXTFITPOLICY=
WRAP | SHORT | TRUNCATE
SHORTTEXT=
( text-items )
The text
fitting policies take effect when the length of the text and/or its
font properties cause the text line to exceed the space available
for it. The font properties include the font family, font size, and
font weight (BOLD or NORMAL). Thus, adjusting the length of the text
and/or changing its font properties are adjustments you can make to
fit text in the available space. You can also use the TEXTFITPOLICY=
and/or SHORTTEXT= options.
The following
long title uses the default fit policy, which is to wrap text that
does not fit on a single line:
entrytitle "This is a lot of text to display on one line";
Notice
that the current horizontal alignment (CENTER in this case) is used
when text wraps. Text is wrapped only at word boundaries (a space).
This next example sets the fit policy to TRUNCATE, and the ellipsis
in the output text indicates where the truncation occurs.
Rather
than truncating text, you can specify alternative "short" text to
substitute whenever the primary text will not fit without wrapping
in the available space. The short text is substituted whenever the
primary text won't fit without wrapping.
entrytitle "This is a lot of text to display on one line" /
  textfitpolicy=short shorttext=("Short alternative text");


