Sizing Issues
Row and Column Sizes
Unlike
the LATTICE layout, the GRIDDED layout offers no way to control column
sizes or row sizes. These sizes are determined by the contents of
the cells. If only plots are used in the cells, the grid is partitioned
equally based on the graph size. However, any individual cell in the
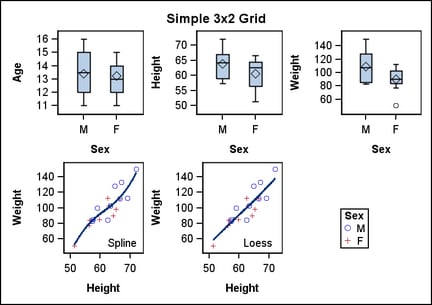
grid might contain a legend or text. Consider the next two examples,
in which the sixth cell of the grid is populated with a legend.
layout gridded /  columns=3 rows=2 columngutter=10 rowgutter=10;
  /* standalone plot statements define cells 1-3 */
     boxplot x=sex y=age;
     boxplot x=sex y=height;
     boxplot x=sex y=weight;

  /* overlay blocks define cells 4-5 */
     layout overlay;
       scatterplot y=weight x=height / group=sex name="scatter" ;
       pbsplineplot y=weight x=height;
       entry halign=right "Spline" / valign=bottom;
	     endlayout;

     layout overlay;
       scatterplot y=weight x=height / group=sex;
       loessplot y=weight x=height;
       entry halign=right "Loess " / valign=bottom;
     endlayout;

  /* legend defines cell 6 */
     discretelegend "scatter" / title="Sex";
endlayout;
In this
first case, the legend height and width are smaller than the default
column and rows sizes, so the legend fits nicely into the empty cell.
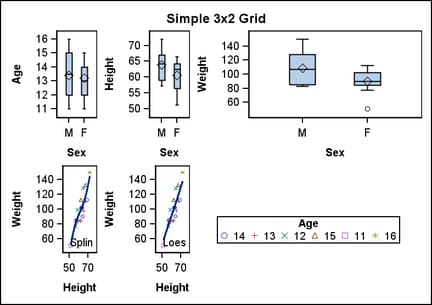
However,
this second case demonstrates that if the legend is larger than the
default column width or row height, the legend size has precedence
and the cell size is adjusted to fit the legend. The same thing might
happen when ENTRY statements with lengthy strings are used in cells.
Because
of this behavior, you should consider using a LATTICE layout whenever
you want to enforce uniform or user-defined column widths and row
heights for the grid, regardless of cell contents. If this layout
were changed to a LATTICE, the legend would be either omitted or clipped,
depending on the setting of the DISPLAYCLIPPED= option of the DISCRETELEGEND
statement.
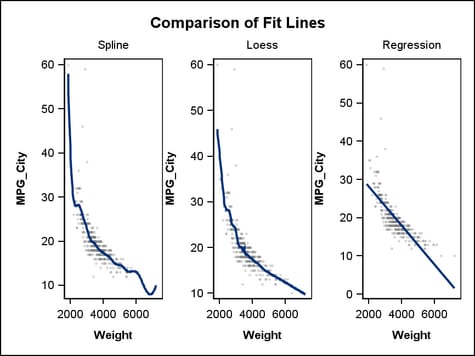
Even when
the GRIDDED layout does not contain legend or text statements, the
plot-area size in a row or column in the grid might be changed by
cell contents. Consider this three-cell GRIDDED layout with OVERLAY
layouts defining each cell.
Because the Y axes are duplicated across cells, you might
try to conserve space by turning off the Y axes for the second and
third cells. You can do this with the YAXISOPTS=( DISPLAY=NONE) option
of the OVERLAY layout. Here is the result:
Once again,
the three cells have the same size, but the plot areas do not because
the cells that no longer display the Y axis have extended the plot
areas into the space that formerly displayed the axes. Rather than
using the GRIDDED layout, you can use the LATTICE layout to ensure
that the three plot areas have the same size:
This graph
was produced with LATTICE layout with an external axis. See Using an Advanced Multi-cell Layout for details.
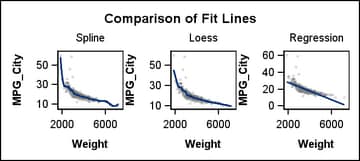
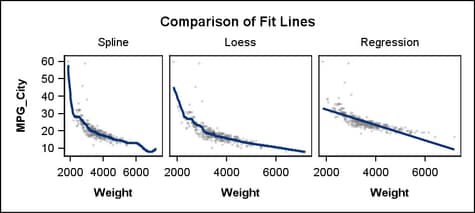
Adjusting Graph Size
When defining
the grid size, you will generally have some idea of a good overall
aspect ratio for the graph. For example, if you are creating a one
row by three column grid, the graph has a default aspect ratio of
4:3 and looks as follows:
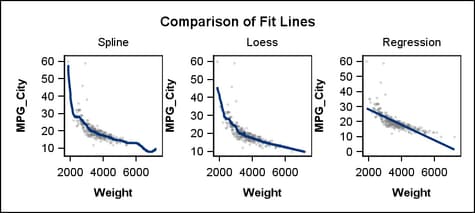
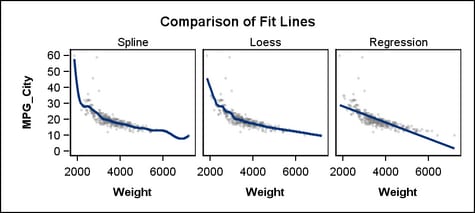
The graph would look better if the graph height were
smaller in relation to the width. You can establish a good default
graph size in the template definition by setting the DESIGNWIDTH=
and DESIGNHEIGHT= options in the BEGINGRAPH statement. After some
experimentation, you might decide that something closer to a 2:1 aspect
ratio looks good:
begingraph / designwidth=400px designheight=180px;
The DESIGNWIDTH= and DESIGNHEIGHT=
options set the graph size as part of the template definition so that
if you later want a larger or smaller version of this graph, you can
use the ODS GRAPHICS statement rather than resetting the design size
and recompiling the template. You need only specify either a WIDTH=
or a HEIGHT= option in the ODS GRAPHICS statement. The other dimension
is automatically computed for you, based on the aspect ratio that
is specified in the compiled template by the DESIGNWIDTH= and DESIGNHEIGHT=
options.