Creating an Axis-Aligned Inset with a Block Plot
Sometimes
you want an inset to provide information on values along an axis.
In the following example, "events" have been defined over time and
the inset information at the top of the plot provides information
about these events.
The example
uses a BLOCKPLOT statement, which creates one or more strips of rectangular
blocks containing text values. The width of each block corresponds
to specified numeric intervals along the X-axis.
The following
template code defines a template named BLOCKPLOT1, which is used to
create this graph. In the template code, the block plot is overlaid
with a series plot to create an axis-aligned inset. Notice that the
BLOCKPLOT statement requires two input columns: on for the X= argument
and another for the BLOCK= argument. The BLOCK= transition points
control the boundary of each block and the text that is displayed.
The range of the X= values between two consecutive block transition
points determine the width of each block.
proc template;
define statgraph blockplot1;
begingraph;
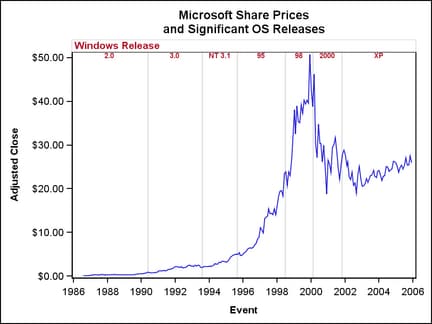
entrytitle "Microsoft Share Prices";
entrytitle "and Significant OS Releases";
layout overlay;
blockplot x=event block=release / display=(outline values label)
valuevalign=top valuehalign=center labelposition=top
valueattrs=GraphDataText(weight=bold
color=GraphData2:contrastcolor)
labelattrs=GraphValueText(weight=bold
color=GraphData2:contrastcolor)
outlineattrs=(color=GraphGridLines:color);
seriesplot x=date y=adjClose / lineattrs=GraphData1;
endlayout;
endgraph;
end;
run;
The BLOCKPLOT
statement supports many options for controlling the content, position,
and appearance of the blocks and text information.
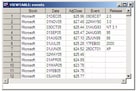
The input
data that is used with the BLOCKPLOT1 template must contain data for
both plots. The simplest way to construct the appropriate data is
to create separate X= variables for the block plot ( EVENT ) and the
scatter plot (DATE).
/* data for block plot – ordered by event */
data MSevents;
  input Event date9. Release $7.;
  label Release="Windows Release";
  format Event date.;
datalines;
09dec1987 2.0
22may1990 3.0
01aug1993 NT 3.1
24aug1995 95
25jun1998 98
17feb2000 2000
25oct2001 XP
run;

/* non-match merge of input data */
data events;
  merge sashelp.stocks(keep=stock date adjClose
                       where=(stock="Microsoft"))
        MSevents;
run;

proc sgrender data=events template=blockplot1;
run;
The next
example shows a different way to present the same information. Here
the outlines are removed and the blocks are filled with colors. The
example uses the following BLOCKPLOT options:
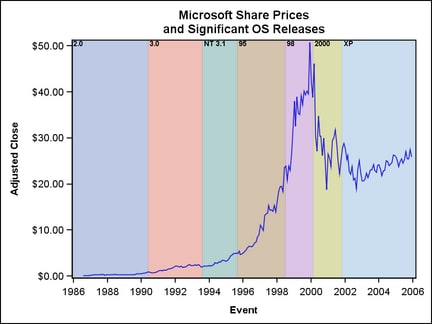
In this
example, the FILLATTRS=MULTICOLOR setting ensures that the colors
will be obtained from the GraphData1 to GraphDataN style elements
of the current style. Transparency is added to fade the colors. The
block label "Windows Release" is suppressed, and the horizontal alignment
of the block values is shifted to the left.
proc template;
  define statgraph blockplot1a;
    begingraph;
      entrytitle "Microsoft Share Prices";
      entrytitle "and Significant OS Releases";
      layout overlay;
        blockplot x=event block=release / display=(fill values)
            valuevalign=top  valuehalign=left
            valueattrs=GraphDataText(weight=bold)
            filltype=multicolor
            datatransparency=.5;
        seriesplot x=date y=adjClose / lineattrs=GraphData1;
    endlayout;
   endgraph;
  end;
run;

proc sgrender data=events template=blockplot1a;
run;
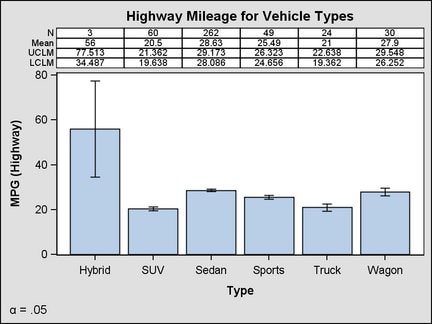
The BLOCKPLOT statement can also
create a table of inset information where the columns are centered
on discrete values along the X-axis and the rows represent different
statistics for each value of the X= variable. This technique for displaying
inset information is possible for plots with a discrete X-axis, such
as box plots and bar charts. The BLOCKPLOT statement supports a CLASS=variable option that creates a separate block
plot for each unique value of the CLASS= variable. Notice that in
this example, the block plot is not located inside the OVERLAY layout
but in its own cell of a LATTICE layout.
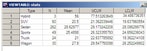
To create
this graph, some data set up is necessary. First, we can use PROC
SUMMARY to create the summarized input data for the block plot and
the bar chart:
/* Create summarized data with desired statistics */
proc summary data=sashelp.cars nway alpha=.05;
  class type;
  var mpg_highway;
  output out=stats(drop=_FREQ_ _TYPE_) n=N mean=Mean uclm=UCLM lclm=LCLM;
run;
However,
the columns that are required for the BLOCKPLOT statement are not
the same as those for the BARCHARTPARM statement. The information
must first be transposed.
/* Transpose data for use with BLOCKPLOT */
proc transpose data=stats
      out=blockstats(drop=_label_
                     rename=(type=type2 _name_=statname col1=stat));
  by type;
  var n mean uclm lclm;
run;
NOTE: There were 6 observations read from the data set WORK.STATS.
NOTE: The data set WORK.BLOCKSTATS has 24 observations and 3 variables.

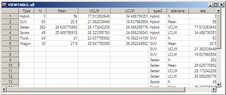
Finally,
the data for the BARCHARTPARM and BLOCKPLOT statements must be non-match
merged into one input data set. Note that the TYPE and TYPE2 variables
must be distinct variables.
/* Combine summary data for BARCHARTPARM with tabular data for BLOCKPLOT */
data all;
  merge stats blockstats;
run;
NOTE: There were 6 observations read from the data set WORK.STATS.
NOTE: There were 24 observations read from the data set WORK.BLOCKSTATS.
NOTE: The data set WORK.ALL has 24 observations and 8 variables.
The template
for this graph uses a BLOCKPLOT statement with X=TYPE2 and BLOCK=STAT.
By default, if there are adjacent repeated values for the BLOCK= column,
a new block does not begin until the BLOCK value changes. The CLASS=STATNAME
setting creates a row (block plot) for each value of the TYPE2 variable.
By default, the values of the CLASS= variable appear as row labels
external to the block plot.
The ROWWEIGHTS
= option for the LATTICE layout governs the relative amount of vertical
space that is allotted to the BLOCKPLOT (15%) and the BARCHARTPARM
(85%). This would have to be changed if you have a much larger or
smaller number of rows in the statistics table.
proc template;
  define statgraph blockplot2;
    begingraph;
      entrytitle "Highway Mileage for Vehicle Types";
      entryfootnote halign=left {unicode alpha} " = .05";
      layout lattice / columns=1 rowweights=(.15 .85);

        blockplot x=type2  block=stat /  class=statname
           includemissingclass=false
           display=(values label outline) valuehalign=center
           labelattrs=GraphDataText valueattrs=GraphDataText;

        barchartparm x=type y=mean / errorlower=lclm errorupper=uclm;

      endlayout;
    endgraph;
  end;
run;

ods listing style=default;
proc sgrender data=all template=blockplot2;
run;