Example 2: Create a Tabular Text Annotation
| Features: |
TEXT annotation PAD option |
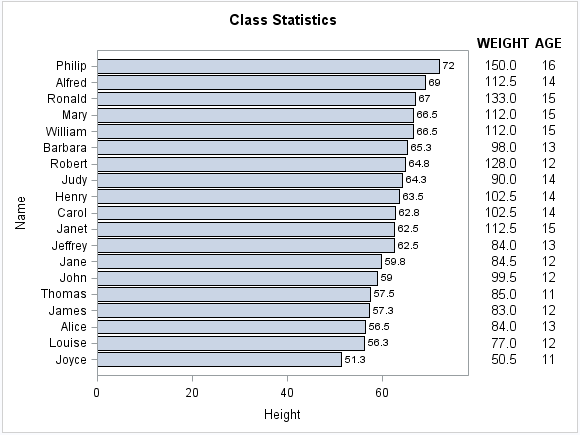
This example
uses the SGPLOT procedure to create an axis-aligned table to the right
of a horizontal bar chart.
Program
data anno;
length y1space $ 12 label $ 6;
set sashelp.class (keep=name weight);
rename name=yc1;
retain y1space "datavalue" x1space "graphpercent" x1 90 function "text"
     textcolor "black" textweight "normal" y1 . anchor "right";
label=put(weight, F5.1);
run;
data temp;
length y1space $ 12 label $ 6;
set sashelp.class (keep=name age);
rename name=yc1;
retain y1space "datavalue" x1space "graphpercent" x1 95 function "text"
    textcolor "black" textweight "normal";
label=put(age, F2.0);
run;
data headers;
length textweight $ 6;
retain y1space "graphpercent" x1space "graphpercent" function "text" y1 90
    textcolor "black" textweight "bold";
x1=87;
label="WEIGHT";
output;
x1=95;
label="AGE";
output;
run;
proc append base=anno (drop=weight) data=temp (drop=age) force nowarn;
run;
proc append base=anno (drop=weight) data=headers force nowarn;
run;
title1 "Class Statistics";
title2 "   ";
proc sgplot data=sashelp.class sganno=anno pad=(right=25%);
hbar name / response=height datalabel nostatlabel
          categoryorder=respdesc;
run;
title1;
Program Description
Create a data set with the Weight column. Use annotation variables to define attributes
for the weight text.
data anno;
length y1space $ 12 label $ 6;
set sashelp.class (keep=name weight);
rename name=yc1;
retain y1space "datavalue" x1space "graphpercent" x1 90 function "text"
     textcolor "black" textweight "normal" y1 . anchor "right";
label=put(weight, F5.1);
run;
Create a data set with the Age column.Use annotation variables to define attributes
for the age text.
data temp;
length y1space $ 12 label $ 6;
set sashelp.class (keep=name age);
rename name=yc1;
retain y1space "datavalue" x1space "graphpercent" x1 95 function "text"
    textcolor "black" textweight "normal";
label=put(age, F2.0);
run;