Data Attachment Examples for Annotations
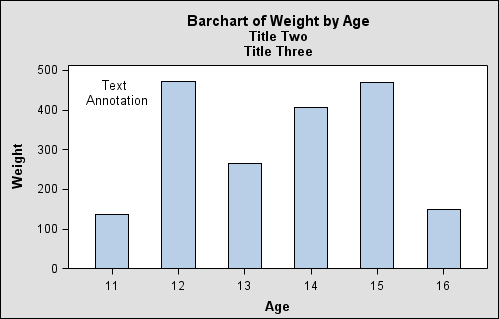
Example: Text Annotation
This example shows how
text annotations behave when the plot area is resized. The behavior
varies depending on whether the annotation is attached to the data.
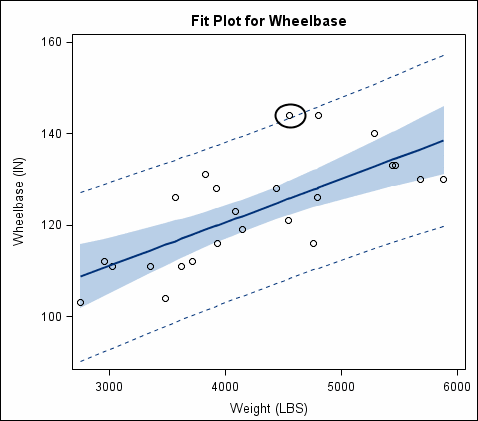
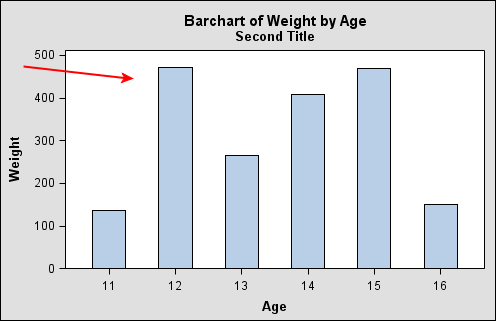
The following display
shows a text annotation in the upper left corner within a plot. In
the example, the text annotation has a red circle around it:
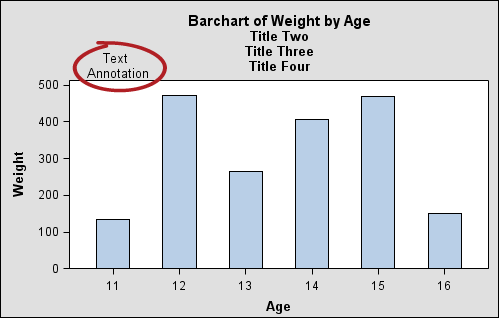
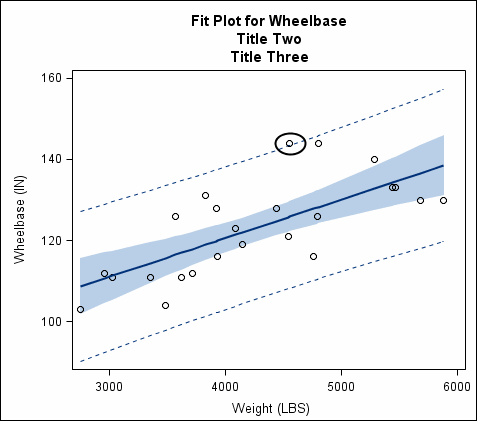
The following display
shows the same graph with titles added. The titles cause the plot
to get smaller. The annotation stays with the data when the graph
is resized.
Example: Oval Annotation Around a Data Point
This example shows the
behavior of ovals that are created around data points when the plot
area is resized. The behavior varies depending on whether the oval
is attached to the data point.
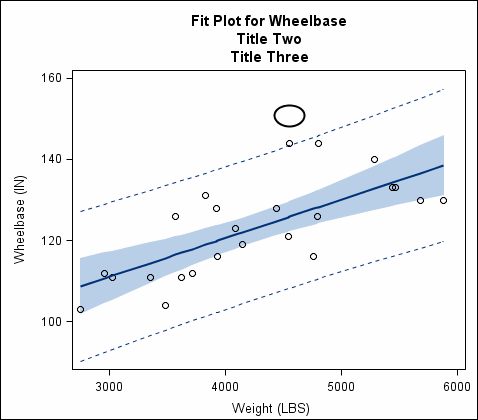
The following display
shows the same graph with more titles added. The titles cause the
plot to get smaller. The oval stays around the data point when the
graph is resized.
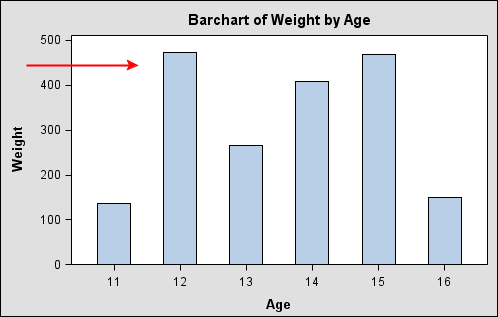
Example: Arrow Annotation Partially Attached to Data
This example shows the
behavior of arrow annotations when the plot area is resized. One end
of the arrow is attached to the data and the other end is not.
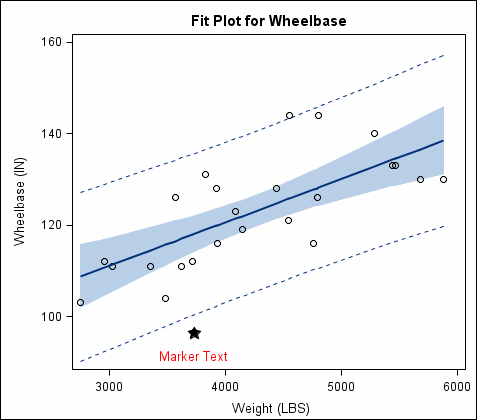
Example: Marker Annotation with Text That Is Cropped
This example shows the
behavior of marker annotations that have text when the text is moved
off the edge of the plot.
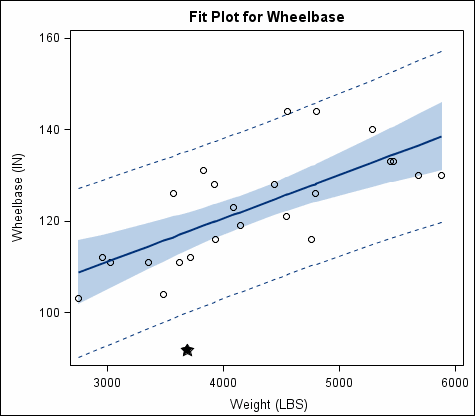
The next display show
the marker after it has been moved downward so that the text moves
outside the plot. The text disappears (is cropped). By default, when
the annotation is attached to the data, any part of the annotation
that resides outside the plot is cropped.
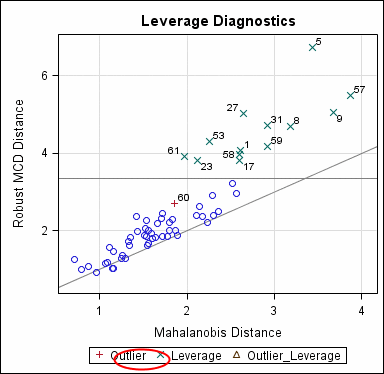
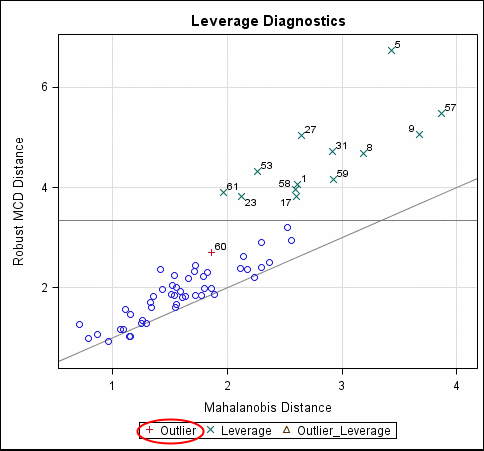
Example: Annotation Positioned Over a Legend in a Graph That Is Resized
This example shows the
behavior of an annotation that is positioned over a legend. Because
it is created outside the plot area, the annotation is not attached
to the data. When the graph is resized, the annotation stays in place.
The following display
shows a graph that has a legend, with an oval created around part
of the legend:
By default, the annotation
is not attached to the data because it was created outside of the
plot area.