Modifying a Multi-Cell Graph That Uses a Single Data Set

About the Class Example

This example uses the Class data set in the SAS Help library. The example provides the height and weight of individual students, who are then grouped by gender. The code uses the SGPANEL procedure to create a graph with two cells, or panels: one cell for females and another cell for males. Both cells are driven by the same data set.
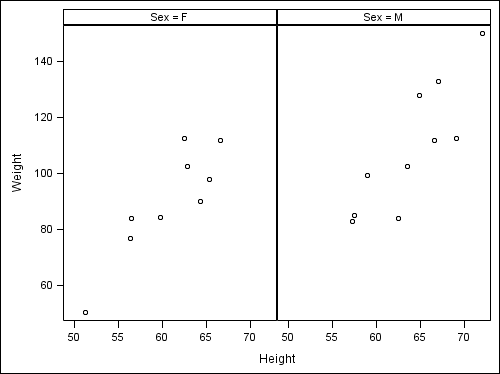
Class Example Created as a Paneled Graph

Code for the Class Example

ods listing sge=on;
proc sgpanel data=sashelp.class;
panelby sex;
scatter x=height y=weight;
run;

Modify the Class Example

Change the Axis Labels for the Graph

In this example, there is one set of axis labels for both cells.
To change the axis labels:
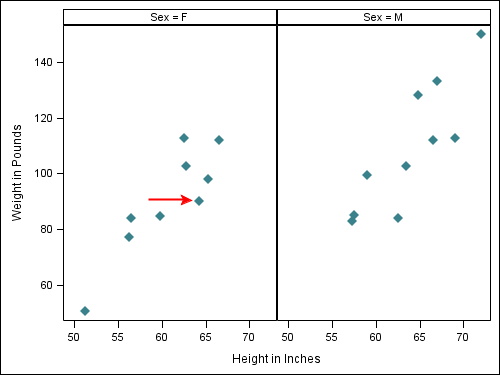
  1. Double-click the X axis label (Height) and change the text to Height in Inches.
  2. Double-click the Y axis label (Weight) and change the text to Weight in Pounds.

Change the Color of the Data Points

When you change the color of the data points in the cells, you modify plot properties. For the type of multi-celled graph used in this example, any change you make to plot properties in one cell affects all cells in the graph.
To change the color of the data points:
  1. Right-click inside either cell and select Plot Properties. The Plot Properties dialog box opens.
  2. In the Plots tab, select a color from the Color list box.
  3. Select Diamond Filled from the Shape list box.
  4. Select 9 from the Size list box.
  5. Click OK.
The data points in both cells have the same color, shape, and size.

Add an Arrow Annotation to One of the Cells

You can annotate an individual cell in a multi-cell graph. In this step, you draw a red arrow in one of the cells.
To draw a red arrow:
  1. Click the arrow icon Arrow icon in the Graph toolbar.
  2. Position your cursor at a starting position in the graph and drag the arrow toward a data point of interest.
  3. Right-click the arrow and select Annotation Properties. The Annotation Properties dialog box opens.
  4. In the Appearance tab, select the red color from the Color list box.
  5. Click OK.

Results of Your Changes

Your changes look similar to the following:
Modified Class Example