About Shared Variables
ODS Graphics Designer
enables you to create graphs that use shared variables. Shared variables
provide these benefits:
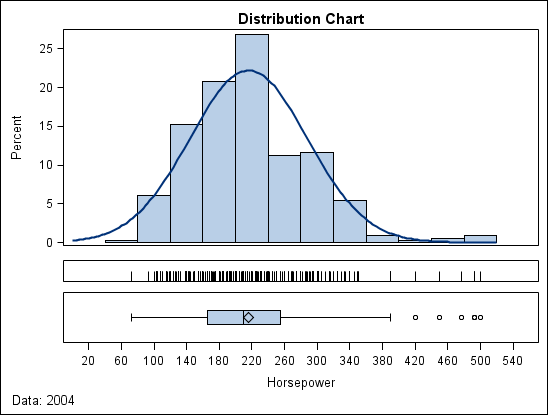
This example involves
a multi-cell graph with three cells that each contain one or more
plots. All plots use the same variable: HORSEPOWER. The example is
based on SASHELP.CARS data.
This graph is very effective
for visualizing the distribution of a measure. After you have created
this graph, you might want to reuse it to view the distribution of
some other variable in the same or different data set.
For example, you might
want to use the example graph to visualize the distribution of the
MPG_CITY variable. In graphs that are not created with shared variables,
you must change the variable for each cell individually. Because the
X axis is shared, during the changes the X axis might briefly display
data from both HORSEPOWER and MPG_CITY. However, when graphs are created
with shared variables, you can change one or more variables for all
plots simultaneously in a single step. Shared variables facilitate
the reuse of graphs, and are especially effective in graphs that have
multiple plots.