Overview of the User Interface

The ODS Graphics Designer user interface consists of several main components, as shown in the following display:
ODS Graphics Designer User Interface
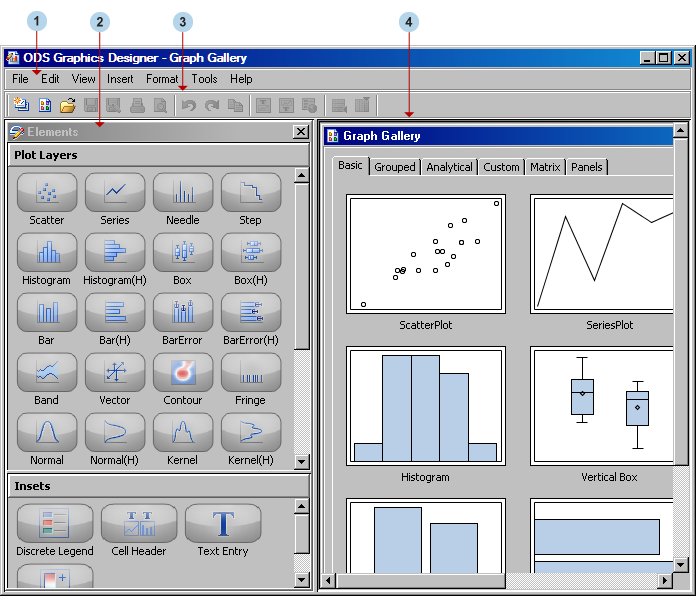
ODS Graphics Designer graphical user interface
1Main menu bar
contains menus that you can use to perform these tasks:
  • open, save, print, and edit SGD files
  • open the Graph Gallery or view the code for a graph
  • insert titles, footnotes, and legends
  • add rows and columns to the graph
  • apply a different style to a graph, customize styles, and define new styles
  • set properties for graphs, plots, axes, legends, and other graph elements
  • set display and usage preferences for the designer
Note: In addition to the main menu, the designer has context menus that you can open by right-clicking various parts of a graph.
2Elements pane
contains plots, lines, and insets that you can insert into a graph. To insert an element, click and drag the element to the graph. The elements on this pane are available only when a graph is open. For more information about the Elements pane, see About the Elements Pane.
3Toolbar
contains icons that you can click to perform commonly used tasks such as saving files and inserting titles or footnotes. The icons on this toolbar are available only when a graph is open.
4Work area
contains one or more graphs that you create and design in the designer. In addition to the graphs, you can display the Graph Gallery, a collection of predefined graphs. For more information about the Graph Gallery, see About the Graph Gallery.