Compatible Plot Types

The ODS Graphics Designer enables you to combine multiple plots together in a graph cell. For example, you can design overlays from a wide array of plot types. Some plots, such as histograms and density plots, are often combined in a graph to achieve an effective overlay layout.
You can add multiple plots to a graph cell as long as the data types are compatible. In other words, the axis types for the plots in the cell must match, whether they are X or X2, Y or Y2.
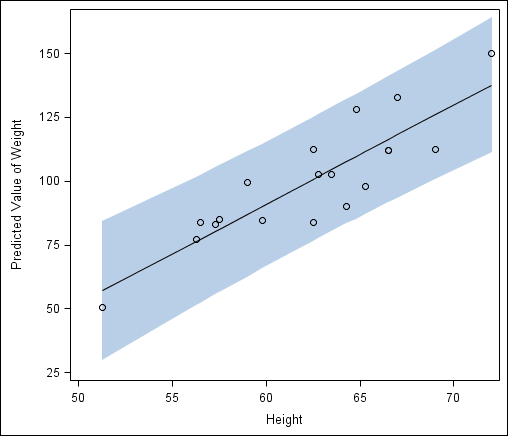
The following graph from the Analytical tab of the Graph Gallery contains several compatible plots, including a band plot, a series plot, and a scatter plot.
Compatible Plots
Compatible Plots
Here are some general guidelines for compatibility:
  • Some plots that show the raw data without any summarization can handle all data types. For example, scatter and series plots can be combined in any situation. However, other plots that also do not provide summarization do have type restrictions. Examples are needle, step, band, and vector plots.
  • Plots such as bar charts that summarize the response data require the response data type to be numeric. Other plots, such as box plots and histograms, create a display based on some analysis of the data. These plots might have special requirements for the data.
    Note that these plots can be vertical or horizontal. The response axis is Y or Y2 for vertical plots and X or X2 for horizontal plots.
  • When a plot that you drag to a cell is incompatible with existing plots in the cell, the ODS Graphics Designer displays a message.