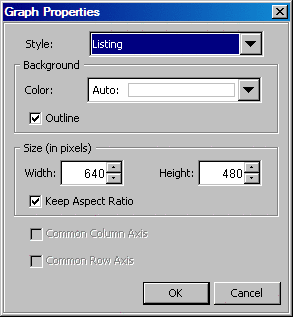
The color
schemes and visual attributes for a graph come from the active ODS
Style. You can change the appearance of a graph by changing the applied
style. You can also change the background color of a graph and the
size of the graph. You can then print or save the modified graph.
To change
these attributes:
-
Right-click
the graph and select
Graph Properties. The
Graph Properties dialog box opens.
-
To change
the style, select a different style from the
Style list box.
-
In the
Background section, select a background color from the
Color list box.
Note: A value of
Auto indicates that the color is derived from
the current style. When you change the style, the background color
changes accordingly. However, if you explicitly change the color,
the color that you specify overrides any style that is applied to
the graph.
Select
or clear the
Outline check box to turn the
graph border on or off.
-
In the
Size section of the dialog box, click the up and down
arrows in the
Width and
Height fields. The width and height are measured in pixels. Clicking an
arrow changes the value by 10 pixels. Your graph becomes larger or
smaller depending on the values you select.
Alternatively,
you can type values in the fields.
To resize
the graph proportionally, make sure that the
Keep Aspect
Ratio check box is selected. If you want to specify the
width and height independently without retaining the current aspect
ratio, then clear the check box.
-
