Creating a Classification Panel

About Classification Panels

A classification panel can be defined using a lattice or a panel layout. Both layouts are data-driven layouts that create a grid of cells based on one or more panel (or classification) variables. The number and layout of the cells is determined by the values of the panel variables.
Here is an example of a simple classification panel:
simple classification panel
Here are the characteristics of classification panels:
  • You can define up to two panel variables in the designer.
  • All panel and plot variables must come from a single data set.
  • Plots can be added to a classification panel the same way they are added to cells in other graphs. When you click and drag a plot to any cell of the panel, the plot is displayed in every cell. The plot is displayed with the appropriate subset of the data for the combination of the panel variables.
  • When you change the plot data or properties in one cell, the change is applied to all the cells of the graph.
You can create a classification panel using two different methods:
  • by using the Graph Gallery
  • from an existing single-cell graph
The following sections describe each method.

Create a Classification Panel by Using the Graph Gallery

The Panels tab of the Graph Gallery contains several predefined classification panels. To create a classification panel:
  1. Select Filethen selectNewthen selectFrom Graph Gallery. The Graph Gallery opens.
  2. On the Panels tab, double-click one of the predefined graphs. The Assign Data dialog box opens and displays the Panel Variables tab.
  3. Specify the SAS library and data set you want to use for the plot(s) by selecting the appropriate items from the Library and Data Set list boxes.
  4. Select one or more classification variables from the list boxes that are available.
  5. (Optional) Select the Customize Panel Layout check box. Then use the arrow controls to specify the number of columns, rows, or combination of both that you want displayed.
  6. Click the Plot Variables tab and assign variables for the plot. If the graph contains more than one plot, make sure that you select the plot you want to define from the Plot list box.
  7. Click OK.

Create a Classification Panel from a Single-Cell Graph

To create a classification panel from a single-cell graph:
  1. Open an existing single-cell graph. A single-cell graph contains only one row and one column.
    You can instead create a new single-cell graph. For instructions, see Create a Graph.
  2. Open the Assign Data dialog box if it's not already open. To open this dialog box, right-click an existing plot and select Assign Data.
  3. Click the Panel Variables tab.
  4. If you want to change the SAS library and data set, select the appropriate items from the Library and Data Set list boxes. If you change the library or data set, make sure that you also change the plot variables, as instructed in step 8.
  5. Select one of the following:
    Data Lattice
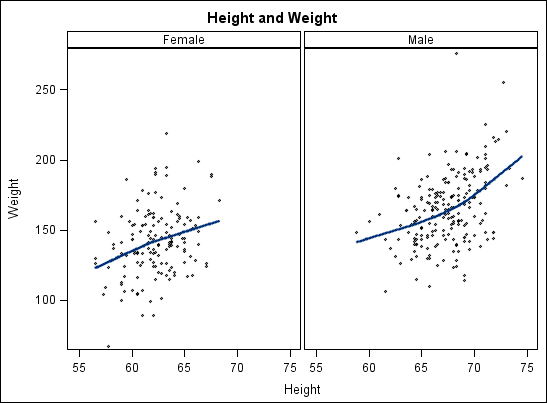
    Headers appear along the top (for column classification variables) and the side (for row classification variables).
    If there are no observations for a particular crossing of the classification variables, the designer creates a blank cell for the crossing. For example, suppose you create a graph with two classification variables: gender and year. Now suppose that there is no data for females in the year 2005. The designer creates a cell for females in 2005, but leaves the cell blank.
    Data Panel
    Headers appear in each cell.
    If there are no observations for a particular crossing of the classification variables, the designer might not create the cell. The designer creates blank cells only to complete the panel grid. For example, suppose your graph contains 10 columns and 10 rows, and only 40% of the cells have data. Instead of having blank cells (as with the lattice) for 60% of the 100 cells, the designer creates a smaller graph. In this example, the graph contains eight rows and five columns.
  6. Select one or more classification variables from the list boxes that are available.
  7. (Optional) Select the Customize Panel Layout check box. Then use the arrow controls to specify the number of columns and rows that you want displayed at any given time. If your panel contains four columns and you specify two columns here, then the designer creates a Next arrow at the bottom of the display. When you click the arrow, the third and fourth column are displayed.
  8. If necessary, click the Plot Variables tab and assign variables for the plot(s).
  9. Click OK.