Change Axis Properties
You can
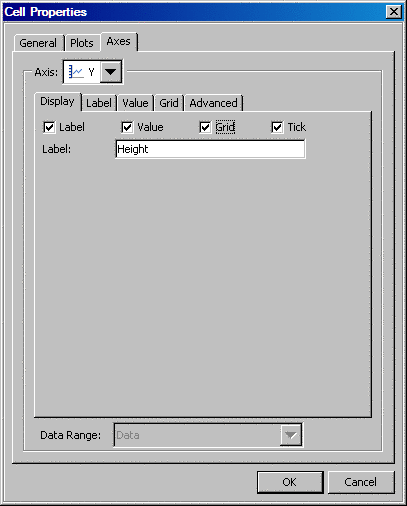
modify the properties of your axes by using the Axes tab of the Cell Properties dialog box. You can specify general display
attributes, such as whether to display a grid and tick marks. You
can also change the font properties for labels and axis values.
-
Select the check boxes for components that you want to be displayed in the graph. You can display the axis label, axis values, a grid, and axis tick marks. You can also change the text for the label.If the Label check box is selected on the Display tab, then you can modify the style element that is applied to the label. Alternatively, you can explicitly set the font properties, such as the color and size. Explicit settings override any style that is applied to the graph.If the Value check box is selected on the Display tab, then you can modify the style element that is applied to the axis values. Alternatively, you can explicitly set the font properties, such as the color and size. Explicit settings override any style that is applied to the graph.