Using the Style Editor
About Styles
The color
schemes and visual attributes for a graph come from the active ODS
Style. The style contains information about the various fonts used
for different textual parts for the graph, such as titles, footnotes,
and axis labels. The style also contains information about colors,
marker shapes and sizes, line patterns, and so on. Styles are designed
to create an aesthetic and effective graph that conveys information
clearly and without clutter.
SAS supplies
a set of predefined styles that can be used with the graphs. If you
want to create a custom style, you can use the TEMPLATE procedure.
Alternatively, you can use the ODS Graphics Designer to create styles.
The designer provides an interactive Style Editor. The Style Editor
shows the association between the different style elements and the
different parts of the graph and provides an easier way to create
a new style.
About the Style Editor
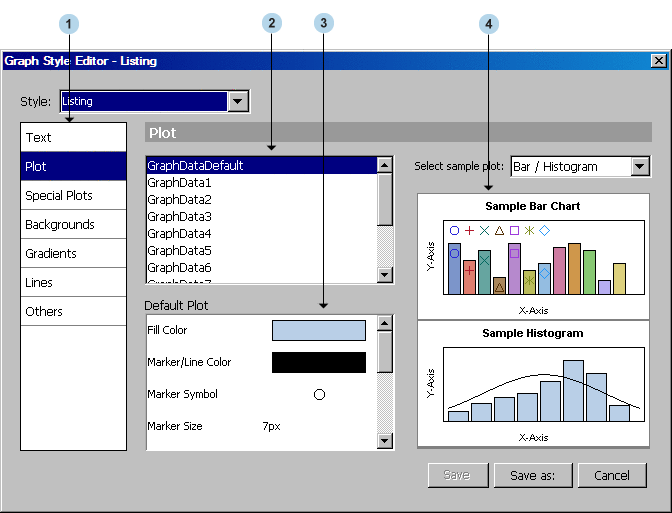

a list of element groups.
A style is made up of elements that are organized in element groups.
The Plot group is selected by default.

the list of elements
that are in the selected element group. By default, these include
all the elements that are used to draw the bars or markers of a plot.
The GraphDataDefault element is selected by default.

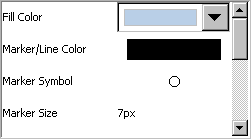
the list of attributes
for each element. By default, the list displays the attributes for
the GraphDataDefault element. You can use the controls to change the
values for the attributes, such as the color, marker symbol, and so
on.

visual representations
that show the relationships between various plot elements and the
style elements. You can click on a part of the graph, such as the
title, footnote, or marker, to see which style element controls a
particular plot element. For example, click on the title and the GraphTitleText
element is selected. You can then change the element's
attributes.