About Data Tables
When you
open a data set or a project, SAS/GRAPH Network Visualization Workshop
displays the data in one or two tables. A table operates somewhat
like a typical spreadsheet. You can edit data, sort data, and perform
other tasks.
All views
of the data in SAS/GRAPH Network Visualization Workshop
(all tables and graphs) are linked through an underlying data model.
Therefore, any changes or selections made in a table are also reflected
in any other views of that same data.
Note: Changes made
to the table remain in effect only while the current project is open.
For example, you might change the value of an observation in a table.
Then, when you close and later reopen the data sets or the project,
your change is not saved.
You can
display a context menu by right-clicking on a column heading or a
row heading. The context menu varies depending on the cursor's position
when you right-click.
|
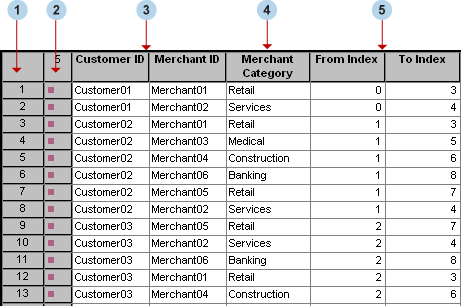
The first column
in the table contains the observation label, which is used to identify
observation markers in graphs. You can change the labels for variables
and observations. For details, see Changing Header Labels.
|
|
|
The second column
contains marker icons that indicate whether an observation is included
in graphs. If you exclude an observation from graphs, then its marker
icon disappears. The shape and color of the marker icons indicate
the following:
You can configure which variable is used to determine marker shapes
and colors by setting data attributes. For details, see Specify Data Attributes.
|
|
|
The third and
fourth columns function as the FROM and TO nodes for your links. Though
the FROM and TO variables are the first variables in this example
data set, they can correspond to any two columns of your data set.
You specify the names for the FROM and TO variables when you set the
data attributes.
|
|
|
When you load
both link and node data,
|


