SAS/GRAPH
Network Visualization Workshop contains pre-defined styles that specify
different colors, fonts, and graphics for the user interface. You
can apply a style to a project or to data tables and graphs that you
have open. Most often, you work with projects.
-
Select
View Style
Style.
-
From the
cascading menu, select the style that you want.
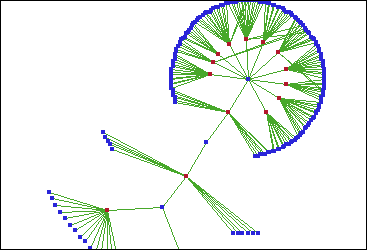
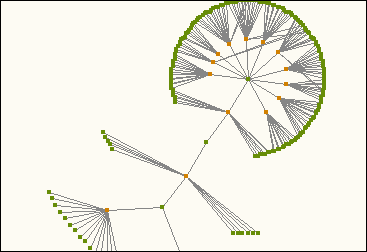
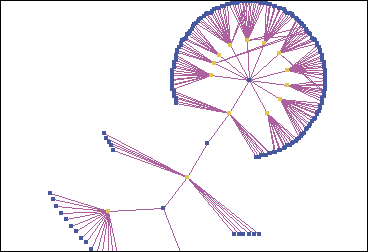
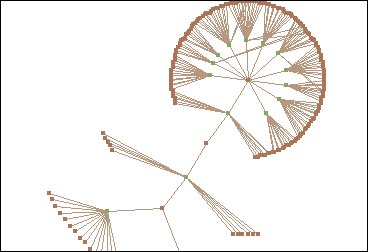
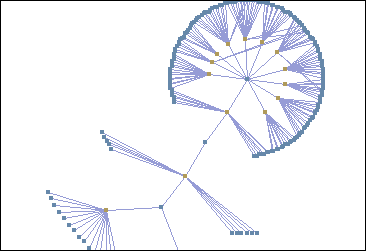
The following
table shows a portion of a hierarchical network graph with the different
styles applied: