Enhancing Graphics Output
SAS/GRAPH
You can also use global
statements and graphics options in
SAS/GRAPH programs. With
global statements, you can add titles and footnotes and control the
appearance of axes, symbols, patterns, and legends. With graphics
options, you can control the appearance of graphics elements by specifying
default colors, fill patterns, fonts, text height, and so on.
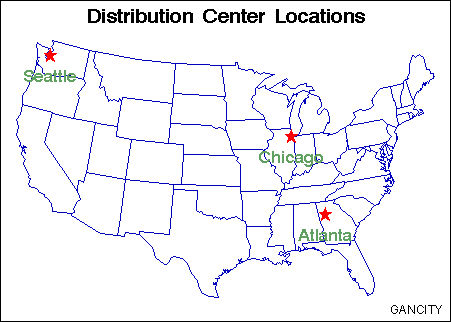
The Annotate Facility
The Annotate facility
enables you to program graphics by using certain variables in SAS
data sets. It is often used to add text or special elements to the
graphics output of other procedures, although it can also be used
to construct custom graphics output. Text and graphics can be placed
at coordinates derived from input data, as well as coordinates expressed
as explicit locations on the display.