Running the %TPLOT macro creates a window displaying a graphical representation of the marker test results.
Figure 10.1 shows an example of the TPLOT results window.
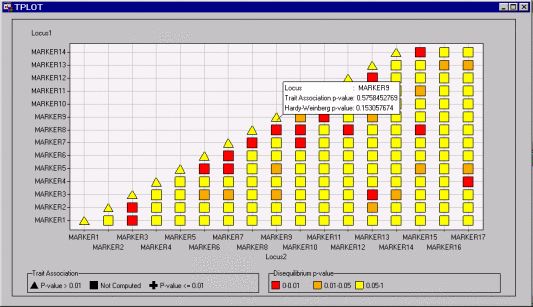
This plot contains a grid of points with symbols that represent the ![]() -values for various marker tests. Colors and shapes of the data points are used to symbolize
-values for various marker tests. Colors and shapes of the data points are used to symbolize ![]() -value ranges. The Show Info About Points button on the toolbar enables the
-value ranges. The Show Info About Points button on the toolbar enables the ![]() -values to be displayed. If you hold down the left mouse button while positioning the mouse pointer on any point in the plot,
the pop-up window appears for off-diagonal points, displaying the two markers being tested for linkage disequilibrium and
the
-values to be displayed. If you hold down the left mouse button while positioning the mouse pointer on any point in the plot,
the pop-up window appears for off-diagonal points, displaying the two markers being tested for linkage disequilibrium and
the ![]() -value of the test; the window displays the marker and its
-value of the test; the window displays the marker and its ![]() -values for the HWE test and marker-trait association test for points on the diagonal, as shown in Figure 10.1.
-values for the HWE test and marker-trait association test for points on the diagonal, as shown in Figure 10.1.
The ![]() -values from the linkage disequilibrium tests between all pairs of markers (or all markers within a certain range of each
other) are represented by the color of the squares on the off-diagonal of the plot. For the points on the diagonal, the results
from the Hardy-Weinberg equilibrium test are displayed instead of the linkage disequilibrium tests since the same marker locus
is on the horizontal and vertical axes.
-values from the linkage disequilibrium tests between all pairs of markers (or all markers within a certain range of each
other) are represented by the color of the squares on the off-diagonal of the plot. For the points on the diagonal, the results
from the Hardy-Weinberg equilibrium test are displayed instead of the linkage disequilibrium tests since the same marker locus
is on the horizontal and vertical axes.
The three ranges of ![]() -values that correspond to different colored symbols in the plot are as follows:
-values that correspond to different colored symbols in the plot are as follows:
- Red
-
[0, 0.01]
- Orange
-
(0.01, 0.05]
- Yellow
-
(0.05, 1]
The disequilibrium test ![]() -values that are plotted can be provided by the output data set from PROC ALLELE, or by a user-created data set meeting the
requirements described in the Syntax: TPLOT Macro section.
-values that are plotted can be provided by the output data set from PROC ALLELE, or by a user-created data set meeting the
requirements described in the Syntax: TPLOT Macro section.
Points on the diagonal also display ![]() -values from marker-trait association tests, using the shape of the symbol to correspond to two categories of
-values from marker-trait association tests, using the shape of the symbol to correspond to two categories of ![]() -values, significant and not significant. The significance level is set to 0.05 by default, but can be modified using the
ALPHA= option in the %TPLOT macro. Thus, for a significance level of
-values, significant and not significant. The significance level is set to 0.05 by default, but can be modified using the
ALPHA= option in the %TPLOT macro. Thus, for a significance level of ![]() , the following shapes represent the following ranges:
, the following shapes represent the following ranges:
- Plus
-
 [0,
[0,  ]
]
- Triangle
-
 (, 1]
(, 1]
Note that the square shape  of the off-diagonal points does not represent a marker-trait association
 ![]() -value since there are two different marker loci represented on the horizontal and vertical axes. These
-value since there are two different marker loci represented on the horizontal and vertical axes. These ![]() -values can be provided by the output data set of PROC CASECONTROL, PROC FAMILY, or PROC PSMOOTH. Alternatively, a user-created
data set that meets the conditions described in the Syntax: TPLOT Macro section can be used.
-values can be provided by the output data set of PROC CASECONTROL, PROC FAMILY, or PROC PSMOOTH. Alternatively, a user-created
data set that meets the conditions described in the Syntax: TPLOT Macro section can be used.