Metric Chart Examples
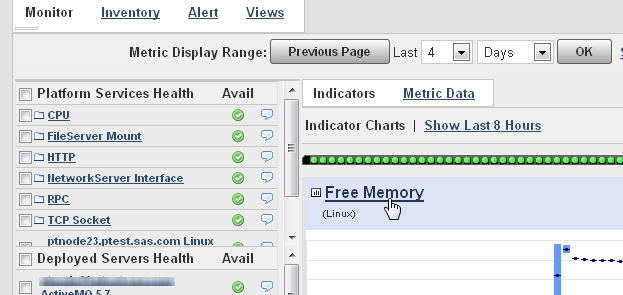
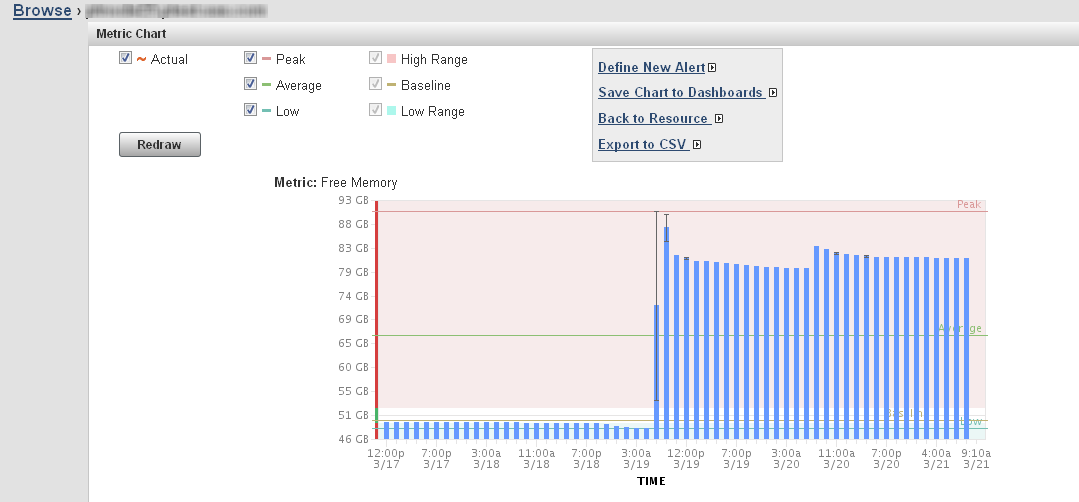
Creating a Free Memory Chart
To create a chart of
the free memory on a server and save the chart to be displayed by
the Saved Chart portlet on your dashboard, follow these steps.
-
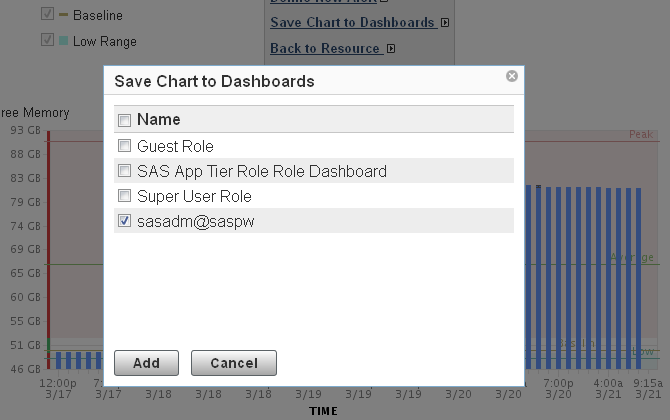
The Save Chart to Dashboards dialog box appears. Select the dashboards on which the saved chart should appear. Click Add to save the chart.Note: The chart will not appear on your dashboard until you create a Saved Chart portlet. See Adding a Saved Charts Portlet for instructions on creating the portlet.
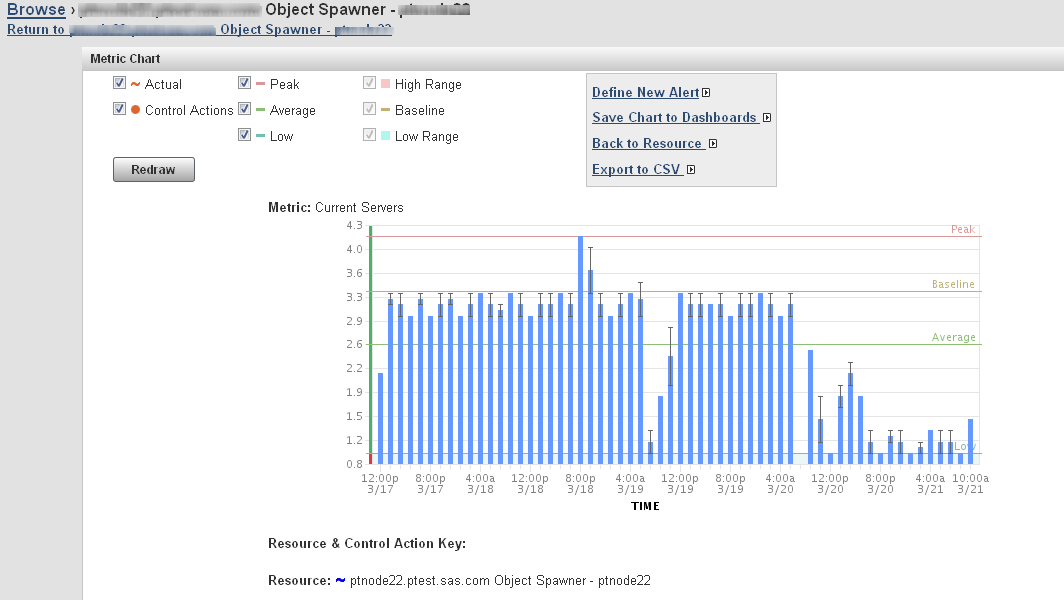
Creating a Number of Spawned Servers Chart
To create a chart of
the current number of spawned servers and save the chart to be displayed
by the Saved Chart portlet on your dashboard, follow these steps.
-
The Save Chart to Dashboards dialog box appears. Select the dashboards on which the saved chart should appear. Click Add to save the chart.Note: The chart will not appear on your dashboard until you create a Saved Chart portlet. See Adding a Saved Charts Portlet for instructions on creating the portlet.

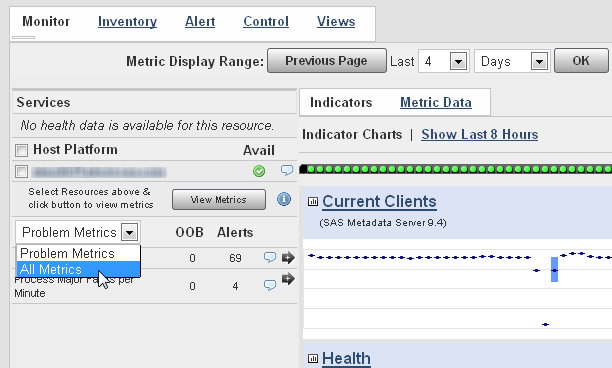
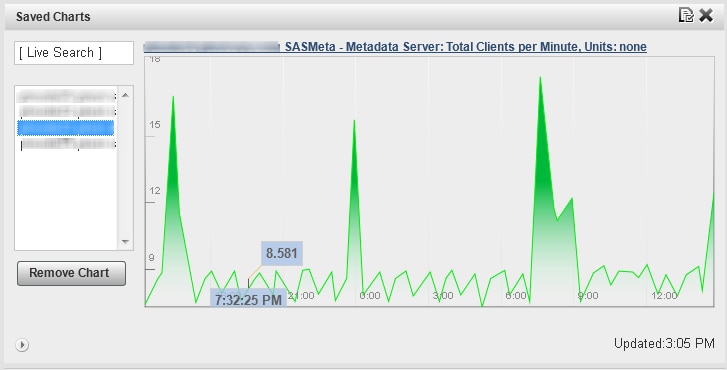
Creating a Metadata Users Chart
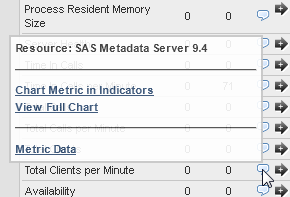
To create a chart of
the current number of users per minute of the SAS Metadata Server
and save the chart to be displayed by the Saved Chart portlet on your
dashboard, follow these steps.
-
The Save Chart to Dashboards dialog box appears. Select the dashboards on which the saved chart should appear. Click Add to save the chart.Note: The chart will not appear on your dashboard until you create a Saved Chart portlet. See Adding a Saved Charts Portlet for instructions on creating the portlet.
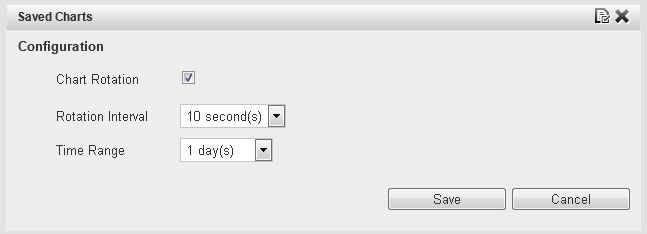
Adding a Saved Charts Portlet
The Saved Charts portlet
displays a rotation of all of the resource metric charts that you
have saved. You can create this portlet before or after you save charts.
If you create the portlet before saving charts, the saved charts will
automatically appear in the portlet as you save them. If you create
the portlet after saving charts, the saved charts will not appear
on your dashboard until you create the portlet.
Follow these steps to
add a Save Charts portlet.
Copyright © SAS Institute Inc. All rights reserved.