Viewing Important Information at a Glance: the Dashboard
The Dashboard is
the starting point when you sign in to SAS Environment Manager. The
page consists of a collection of views (called portlets) of resources,
metrics, and events that are the most important to your environment.
The Dashboard is customizable, so you can
specify how many portlets are displayed, which metrics and functions
they present, and which resources they cover. For example, your Dashboard could
contain a portlet to display recently auto-discovered resources, a
portlet to display recent alerts, or a portlet to display the availability
of a group of selected servers. Selecting an entry (such as a resource
or an alert) in a portlet takes you to detailed information about
the entry.
Each user can access
their own personal Dashboard as well as a Dashboard for
each of the native roles of which the user is a member. Each Dashboard can
be customized to meet the needs of the user or role. For more information
about roles, see About Native Roles and Users.
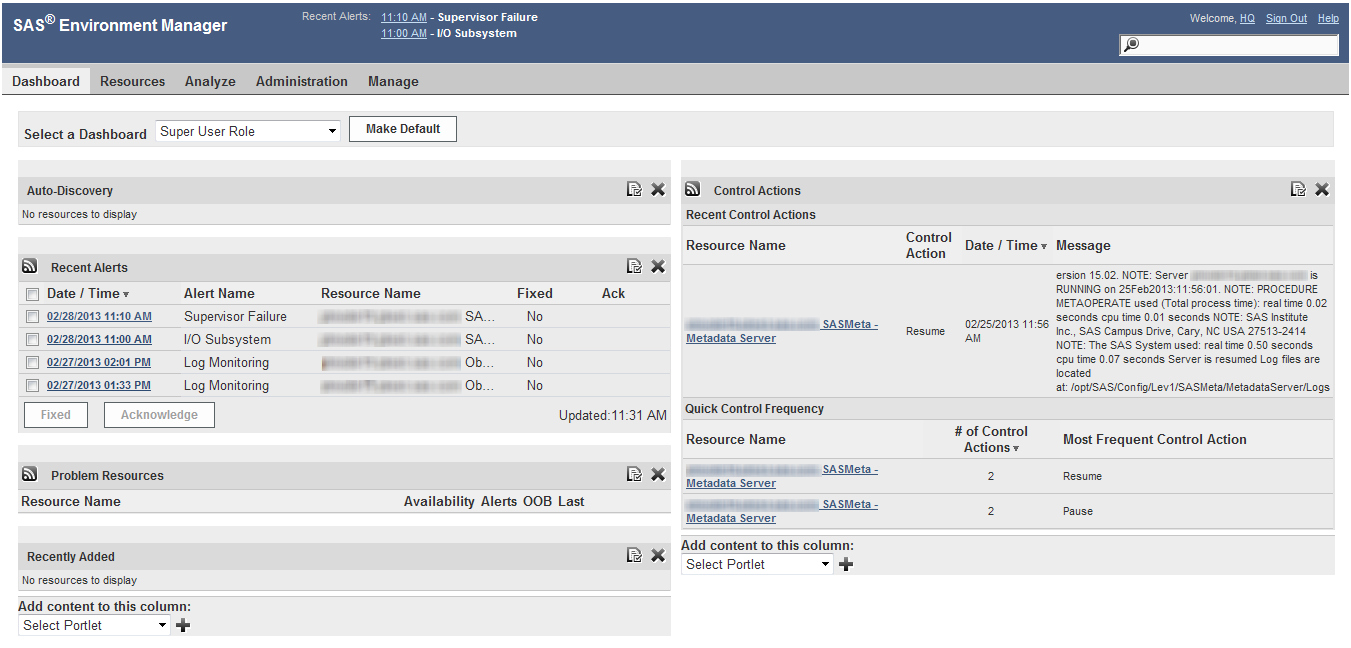
An example Dashboard page
is displayed in this figure.
Copyright © SAS Institute Inc. All rights reserved.