Getting Started with Time Series Forecasting
Prediction Error Plots
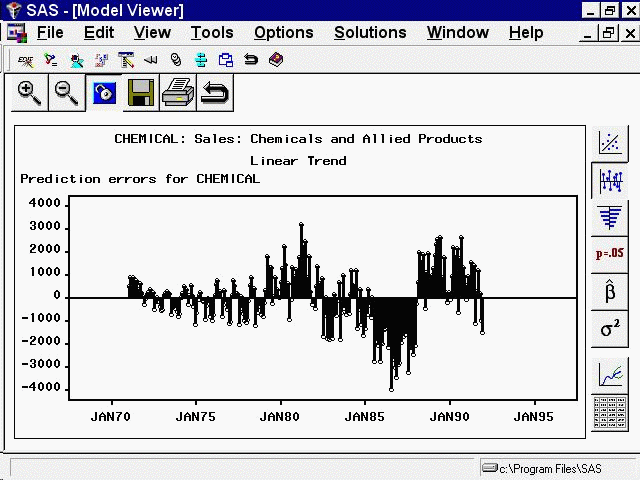
Select the second icon from the top in the vertical toolbar in the Model Viewer window. This switches the Viewer to display a plot of the model prediction errors (actual data values minus the predicted values), as shown in Figure 54.40.
Figure 54.40: Model Viewer: Prediction Errors Plot
If the model being viewed includes a transformation, prediction errors are defined as the difference between the transformed series actual values and model predictions. You can choose to graph instead the difference between the untransformed series values and untransformed model predictions, which are called model residuals. You can also graph normalized prediction errors or normalized model residuals. Use the Residual Plot Options submenu under the Options menu.