Getting Started with Time Series Forecasting
Model List and Statistics of Fit
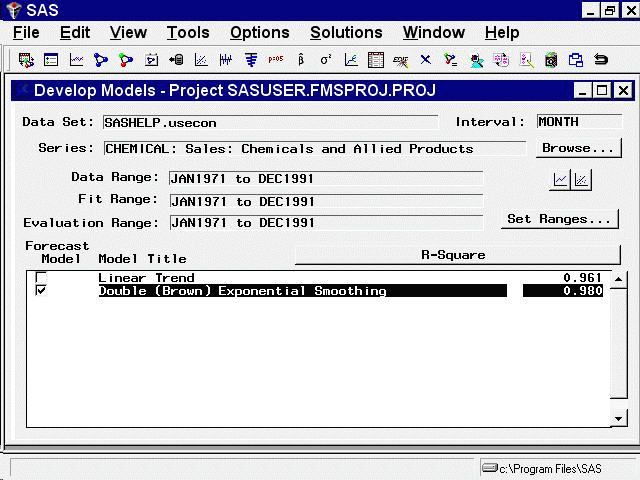
In the model list, the Model Title column shows the descriptive labels for the two fitted models, in this case Linear Trend and Double Exponential Smoothing.
The column labeled Root Mean Square Error (or labeled Mean Absolute Percent Error if you continued from the example in the previous section) shows the goodness-of-fit criterion used to decide which model fits better. By default, the criterion used is the root mean square error, but you can choose a different measure of fit. The linear trend model has a root mean square error of 1203, while the double exponential smoothing model fits better, with a RMSE of only 869.
The left column labeled Forecast Model consists of check boxes that indicate which one of the models in the list has been selected as the model to use to produce the forecasts for the series. When new models are fit and added to the model list, the system sets the Forecast Model flags to designate the one model with the best fit—as measured by the selected goodness-of-fit statistic—as the forecast model. (In the case of ties, the first model with the best fit is selected.)
Because the Double Exponential Smoothing model has the smaller RMSE of the two models in the list, its Forecast Model check box is set. If you would rather produce forecasts by using the Linear Trend model, choose it by selecting the corresponding check box in the Forecast Model column.
To use a different goodness-of-fit criterion, select the button with the current criterion name on it (Root Mean Square Error or Mean Absolute Percent Error). This opens the Model Selection Criterion window, as shown in Figure 54.36.
Figure 54.36: Model Selection Criterion Window
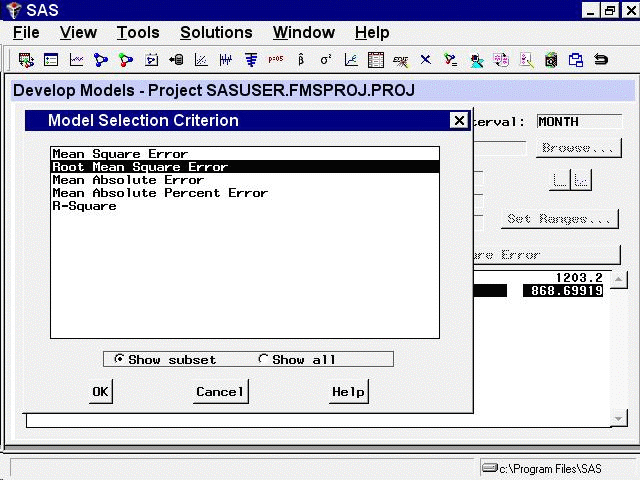
The system provides many measures of fit that you can use as the model selection criterion. To avoid confusion, only the most
popular of the available fit statistics are shown in this window by default. To display the complete list, you can select
the Show all option. You can control the subset of statistics listed in this window through the Statistics of Fit item in the Options
menu on the Develop Models window.
Initially, Root Mean Square Error is selected. Select R-Square and then select the OK button. This changes the fit statistic displayed in the model list, as shown in Figure 54.37.
Figure 54.37: Model List with R-Square Statistics
Now that you have fit some models to the series, you can use the Model Viewer button to take a closer look at the predictions of these models.