Forecasting Process Details
Forecasting
The forecasting generation process is described graphically in Figure 61.3.
Figure 61.3: Forecasting Flow Diagram
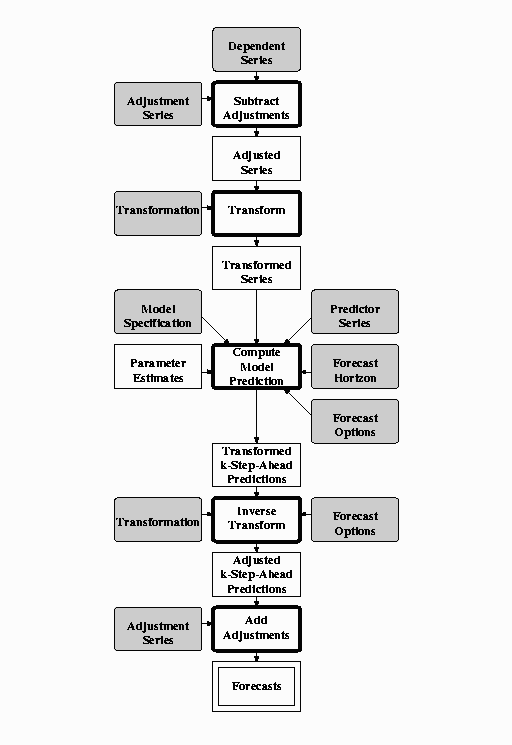
The forecasting process is similar to the model evaluation process described in the preceding section, except that k-step-ahead predictions are made from the end of the data through the specified forecast horizon, and prediction standard errors and confidence limits are calculated. The forecasts and confidence limits are displayed in the Forecast plot or table of the Model Viewer window.