| SAS/ETS Model Editor Window Reference |
| Graphing Options Window |
When you click Graphing Options in the Time Series window, the Graphing Options window opens.
Figure 47.21
Graphing Options Window
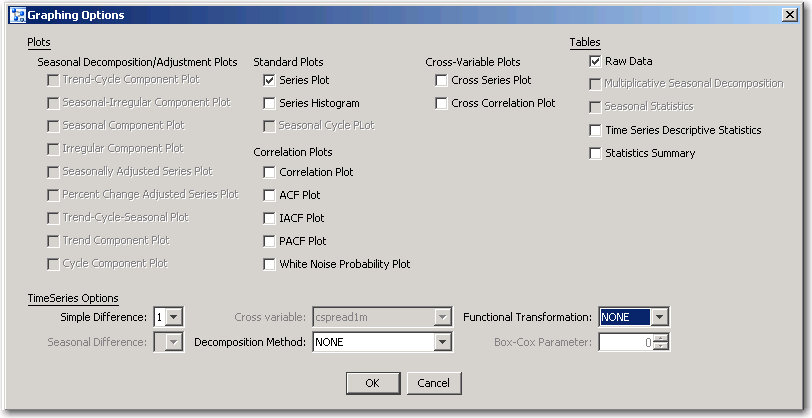
This window has the following controls and fields:
- Plots
includes the groups of check boxes for Seasonal Decomposition/Adjustment Plots, Standard Plots, Correlation Plots, and Cross-Variable Plots.- TimeSeries Options
enables you to select values for simple difference, seasonal difference, cross-variable, decomposition method, functional transformation, and Box-Cox parameter.- Tables
indicates which tables to display.- OK
closes the window and returns to the Time Series window.- Cancel
closes the window without implementing any changes.
Copyright © SAS Institute, Inc. All Rights Reserved.