| The AUTOREG Procedure |
| Goodness-of-fit Measures and Information Criteria |
This section discusses various goodness-of-fit statistics produced by the AUTOREG procedure.
Total R-Square Statistic
The total R-Square statistic (Total Rsq) is computed as
 |
where SST is the sum of squares for the original response variable corrected for the mean and SSE is the final error sum of squares. The Total Rsq is a measure of how well the next value can be predicted using the structural part of the model and the past values of the residuals. If the NOINT option is specified, SST is the uncorrected sum of squares.
Regression R-Square Statistic
The regression R-Square statistic (Reg RSQ) is computed as
 |
where TSST is the total sum of squares of the transformed response variable corrected for the transformed intercept, and TSSE is the error sum of squares for this transformed regression problem. If the NOINT option is requested, no correction for the transformed intercept is made. The Reg RSQ is a measure of the fit of the structural part of the model after transforming for the autocorrelation and is the R-Square for the transformed regression.
The regression R-Square and the total R-Square should be the same when there is no autocorrelation correction (OLS regression).
Mean Absolute Error and Mean Absolute Percentage Error
The mean absolute error (MAE) is computed as
 |
where  are the estimated model residuals and
  is the number of observations.
The mean absolute percentage error (MAPE) is computed as
 |
where  are the estimated model residuals,
  are the original response variable observations,
  if
if  ,
,  if
if  , and
, and  is the number of nonzero original response variable observations.
Calculation of Recursive Residuals and CUSUM Statistics
The recursive residuals  are computed as
 |
 |
 |
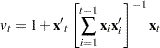 |
Note that the first  can be computed for
  , where
  is the number of regression coefficients. As a result, first recursive residuals are not defined. Note also that the forecast error variance of
  is the scalar multiple of
  such that
  .
.
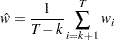
The CUSUM and CUSUMSQ statistics are computed using the preceding recursive residuals.
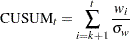 |
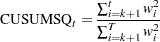 |
where  are the recursive residuals,
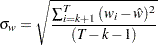 |
 |
and  is the number of regressors.
The CUSUM statistics can be used to test for misspecification of the model. The upper and lower critical values for CUSUM are
are
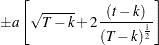 |
where a = 1.143 for a significance level 0.01, 0.948 for 0.05, and 0.850 for 0.10. These critical values are output by the CUSUMLB= and CUSUMUB= options for the significance level specified by the ALPHACSM= option.
The upper and lower critical values of CUSUMSQ are given by
 |
where the value of a is obtained from the table by Durbin (1969) if the 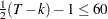 . Edgerton and Wells (1994) provided the method of obtaining the value of a for large samples.
These critical values are output by the CUSUMSQLB= and CUSUMSQUB= options for the significance level specified by the ALPHACSM= option.
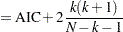
Information Criteria AIC, AICC, SBC, and HQC
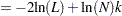
Akaike’s information criterion (AIC), the corrected Akaike’s information criterion (AICC), Schwarz’s Bayesian information criterion (SBC), and the Hannan-Quinn information criterion (HQC), are computed as follows:
 |
 |
|||
 |
 |
|||
 |
 |
|||
 |
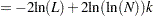 |
In these formulas, L is the value of the likelihood function evaluated at the parameter estimates, N is the number of observations, and k is the number of estimated parameters. Refer to Judge et al. (1985), Hurvich and Tsai (1989), Schwarz (1978) and Hannan and Quinn (1979) for additional details.
Copyright © SAS Institute, Inc. All Rights Reserved.