Using the Variable Selection Node
Selecting Variables Using the R-Square Criterion
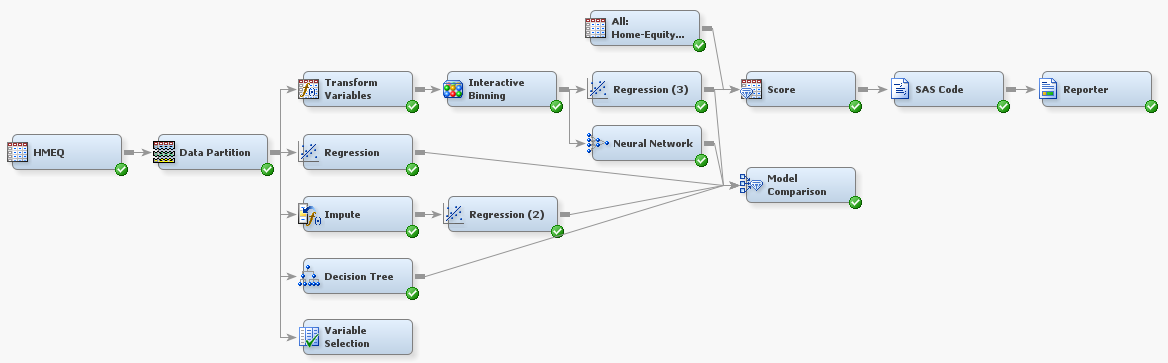
On the Explore tab,
drag a Variable Selection node to your diagram
workspace. Connect the Data Partition node
to the Variable Selection node.
Set the value of the Max
Missing Percentage property to
10.
This eliminates variables that have more than 10% of their values
missing.
Set the value of the Target
Model property to R-Square.
This indicates that the r-square criterion is used to evaluate and
select variables. Notice that the Chi-Square Options properties
subgroup is now unavailable. Use the default values of the properties
in the R-Square Options subgroup.
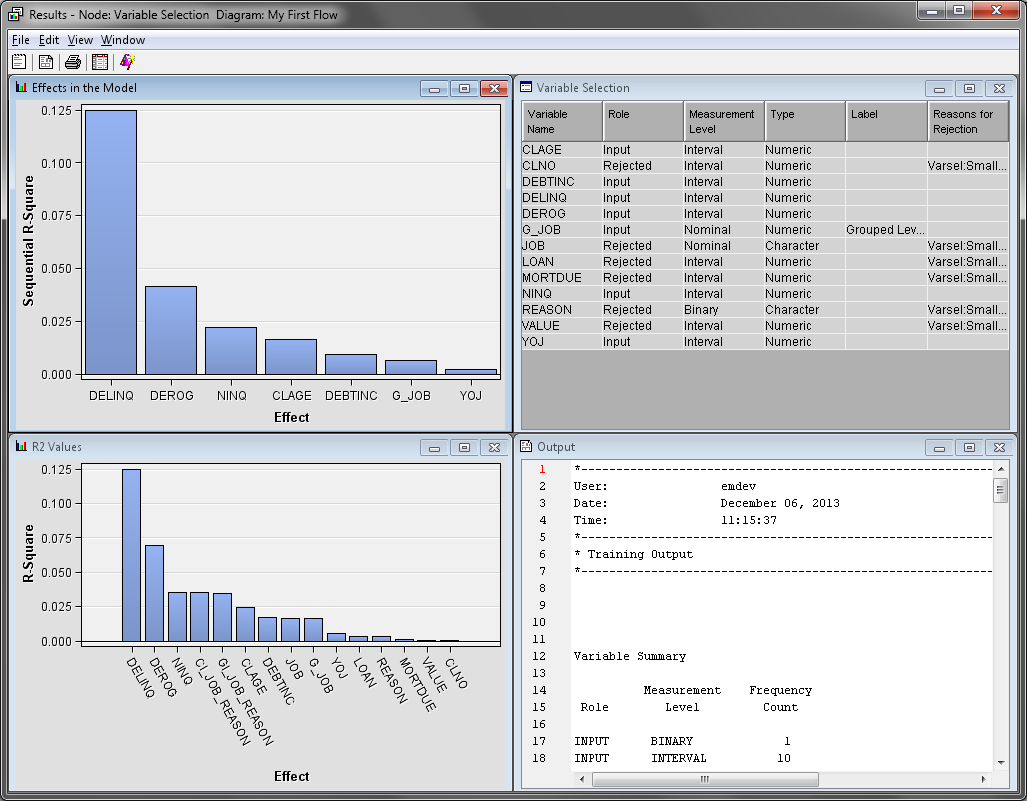
The R-Square criterion
uses a goodness-of-fit criterion to evaluate variables. It uses a
stepwise method of selecting variables that stops when the improvement
in the r-square value is less than 0.0005. By default, this method
rejects variables whose contribution to the r-square value is less
than 0.005.
The following three-step
process is done when you apply the R-Square criterion
to a binary target. When the target is non-binary, only the first
two steps are performed.
Right-click the Variable
Selection node and click Run.
In the Confirmation window, click Yes.
Click Results in the Run Status window.
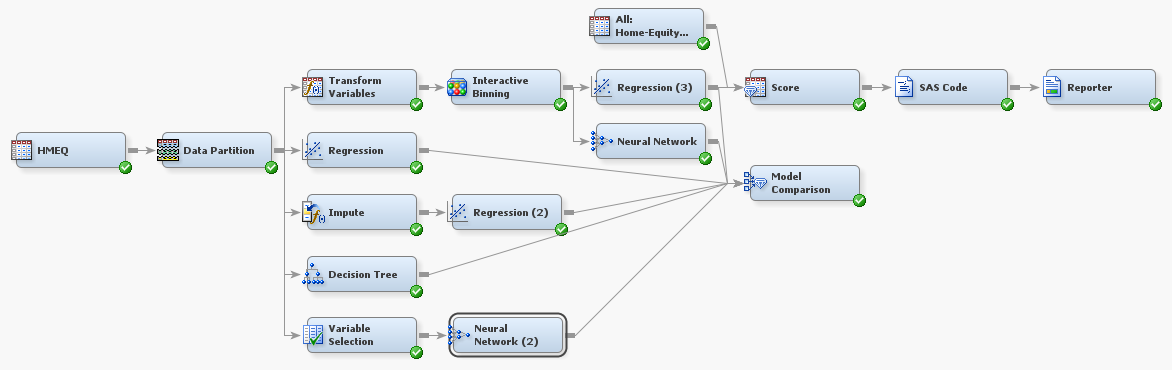
Creating and Evaluating a Neural Network Model
On the Model tab,
drag a Neural Network node to your diagram
workspace. Connect the Variable Selection node
to the Neural Network (2) node. Connect the Neural
Network (2) node to the Model Comparison node.
It is highly recommended
that you perform some type of variable selection before building neural
network models. Neural network models are very flexible, but they
are also very computationally intense. Failure to reduce the number
of input variables can result in the following:
As in the previous chapter,
use the default settings for the Neural Network (2) node.
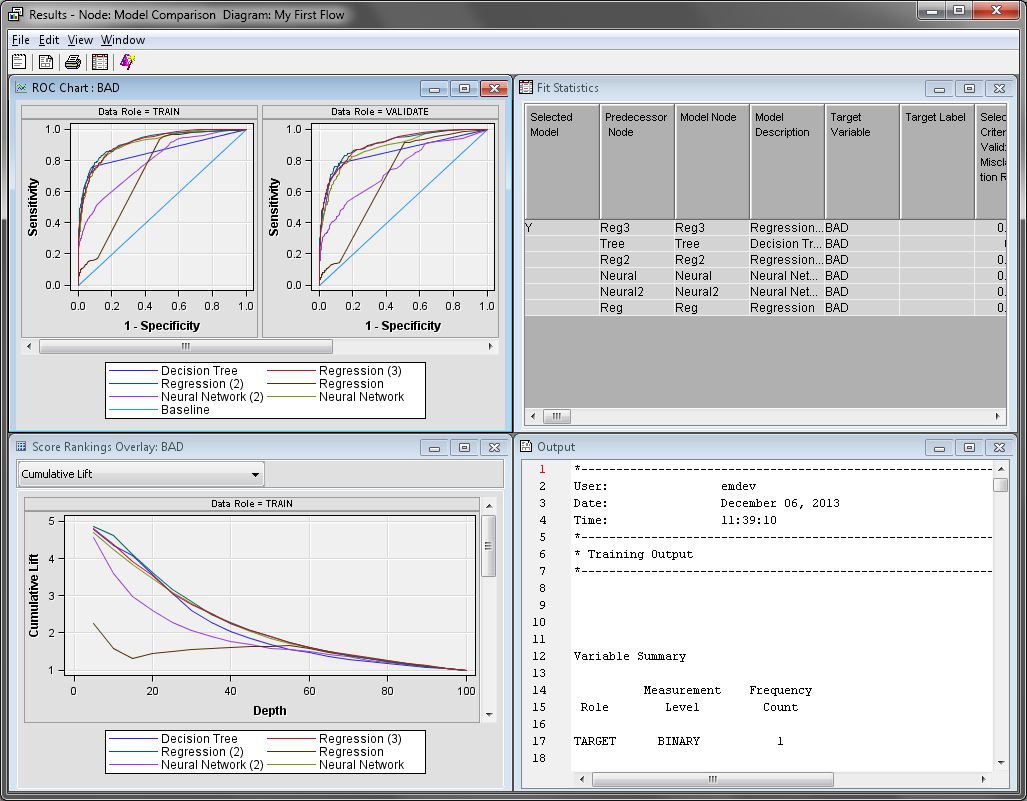
Right-click the Model Comparison node and
click Run. In the Confirmation window,
click Yes. Click Results in
the Run Status window.
Copyright © SAS Institute Inc. All rights reserved.