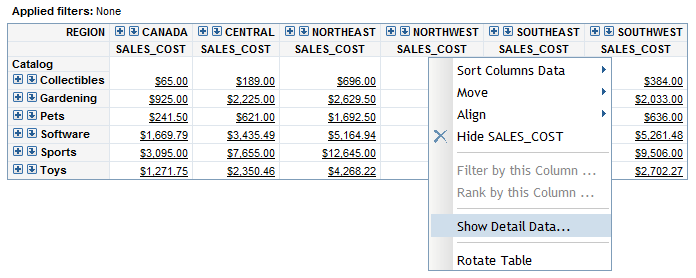
Display the Detail Data Behind the Values in a Crosstabulation Table

Multidimensional data sources sometimes enable viewers to view the detail data behind a specific aggregated value or behind the aggregated values in an 
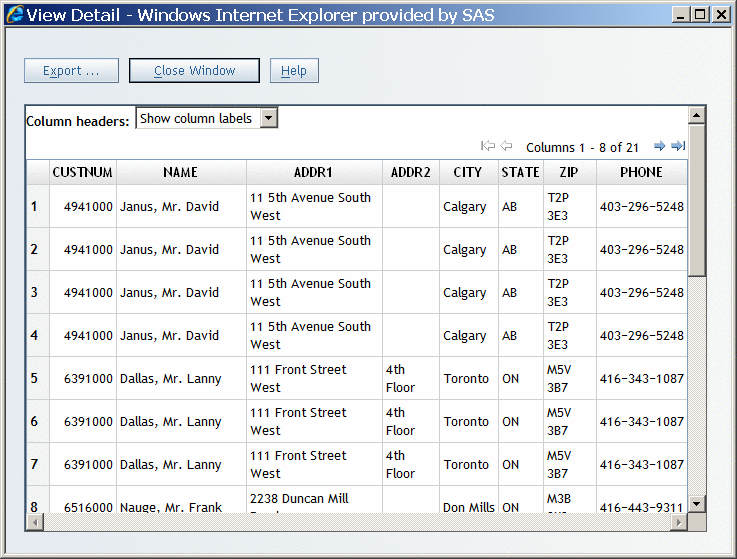
entire row or column. The data is displayed in a separate dialog box. You can export the data to a Microsoft Excel spreadsheet. Your data administrator determines whether detail data is available. If detail data is available, the aggregated values in the crosstabulation table are underlined.
To view detail data, complete these steps:
  1. Perform one of these tasks to open the View Detail dialog box:
    • To see the detail data behind an aggregated value in the crosstabulation table, click the value (which is underlined).
    • To see the detail data behind a row or a column in the crosstabulation table, right-click the row or column heading in the innermost level of the innermost hierarchy in the row or column, and then select Show Detail Data.
      View Detail Option for the Sales Cost Column
      View Detail Option for the Sales Cost Column
    Note: If report linking has been enabled for the values in the crosstabulation table, then when you click on a value you are prompted either to view detail data or to follow the report link.
    View Detail Dialog Box
    View Detail Dialog Box
  2. (Optional) To export the data into a Microsoft Excel spreadsheet or to a Microsoft Word document, click Export to open the Export dialog box. To export the data, click OK. When prompted, choose either to open the file or to save it. For more information on exporting, see Exporting Reports and Report Data.
  3. To exit the View Detail dialog box, click Close Window.