Creating a Dashboard
A dashboard
is a container that has a collection of one or more indicators. A
dashboard is displayed in a portlet, which is displayed on a page
within the SAS Information Delivery Portal. Here is an example of
a dashboard and its components in a portlet:
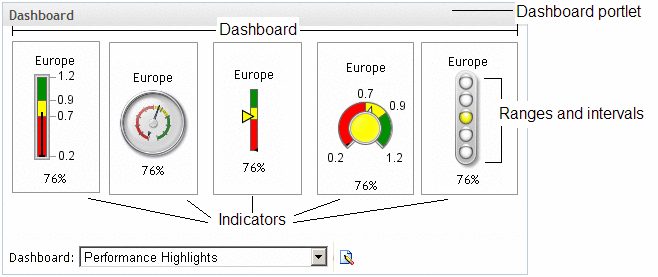
Four components
are required to create and display dashboards within the portal:
-
the data model, which defines the data source and how to access the data within the data source. A data model must be created before an indicator can be defined. (Only one type of indicator, the graph, does not require a data model to be created. This graph indicator is addressed in detail in Graph Display.)Data models are addressed in detail in Data Models.
-
the range, which defines the measurement intervals by which a metric is evaluated, such as below target, on target, and above target. The dashboard administrator can define up to ten intervals. Each segment is assigned a user-selected color that is displayed when a metric falls within that particular segment. Ranges must be created before an indicator can be defined.Ranges are addressed in detail in Ranges.
-
the indicator, which defines the display settings, image types, and links for all metrics displayed in a dashboard. An indicator must be created before a dashboard can be defined.Indicators are addressed in detail in Indicators.
-
the dashboard, which is a collection of indicators to display.Dashboards are addressed in detail in Dashboards.