Using SAS Environment Manager to Monitor and Troubleshoot Data
The following display
shows a sample of the window and monitoring data that is available.
For each SAS Web Application Server instance, metrics can be analyzed
and used to tune the server instance. The metrics can be obtained
by selecting the highlighted links:
SAS Environment Manager Resource Monitoring
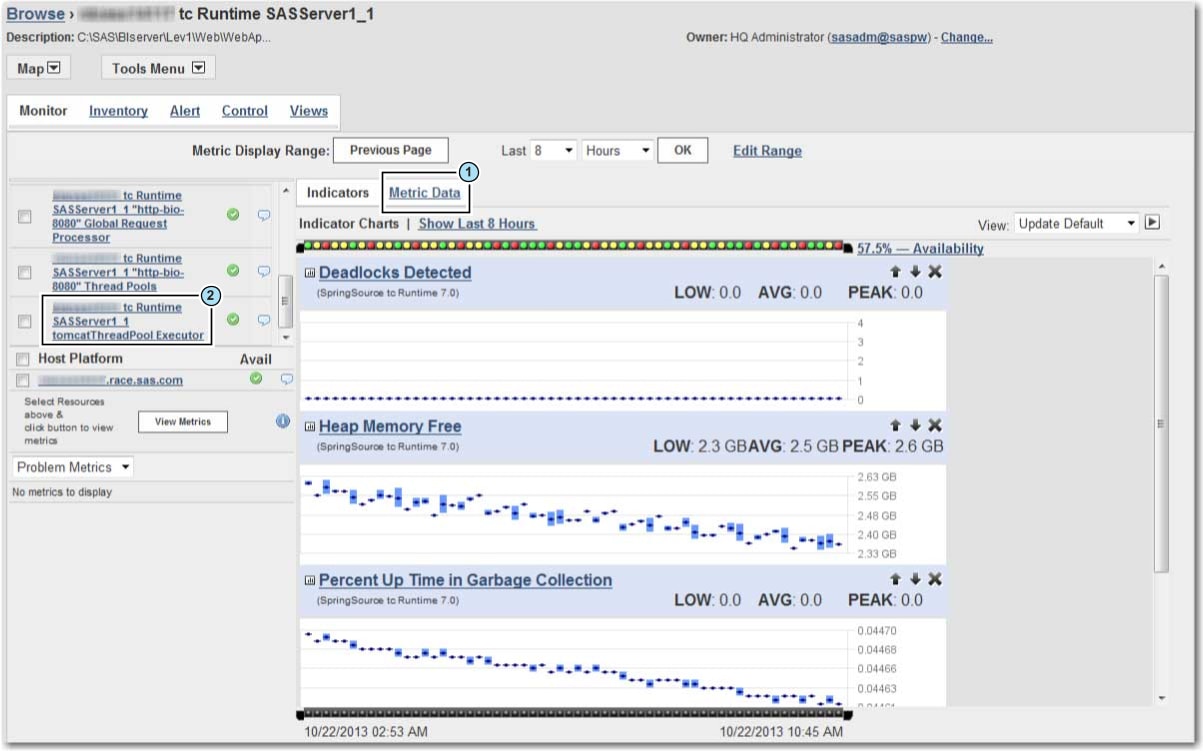
| 1 | Metric Data shows current committed heap size, free heap, max heap, and heap in use. |
| 2 | server-name tc Runtime SASServer1_n tomcatThreadPool Executor shows current committed heap size, free heap, max heap, and heap in use. |
For more information,
see SAS Environment Manager: User’s Guide.
Copyright © SAS Institute Inc. All Rights Reserved.