| Creating Graphs |
Example: Create a 3-D Pie Chart
Open the Fitness Data Set
In this example, you create a pie chart from the Fitness data set. If you have not already done so, open the Fitness data set by following these steps:- Select Tools
 Sample Data ...
 - Select Fitness.
- Click OK to create the sample data set in your Sasuser directory.
- Select File Open By SAS Name ...
- Select Sasuser from the list of Libraries.
- Select Fitness from the list of members.
- Click OK to bring the Fitness data set into the data table.
Specify Pie Chart Variable
To specify the variable to be charted and the chart type, follow these steps:- Select Graphs Pie Chart ...
- Select runtime from the candidate list, and click Chart to make minutes to run 1.5 miles the charted variable.
- Select 3-D under Pie type to specify a three-dimensional chart.
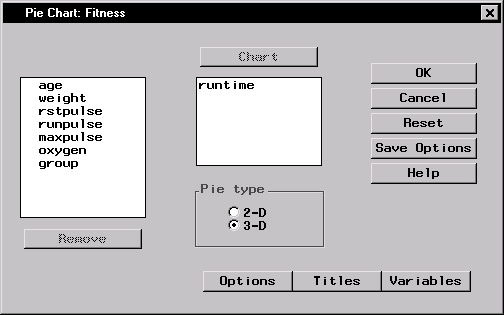
Figure 5.23: Pie Chart Variable and Type
Specify Pie Chart Options
To specify your pie chart options, such as the number of slices, follow these steps:- Click on the Options button to display the Pie Chart Options dialog.
- In the Number of Slices tab, design a chart with ten slices by selecting N slices and clicking on the up arrow until the number 10 is visible.
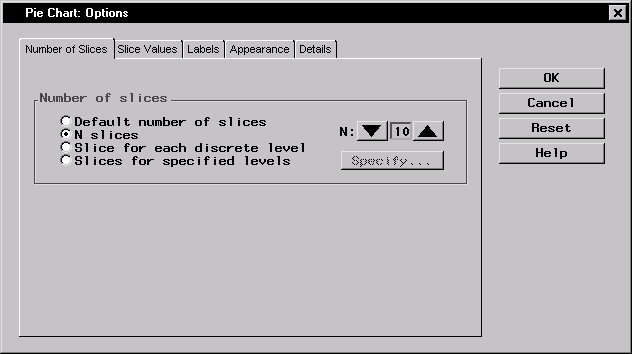
Figure 5.24: Number of Slices in Pie Chart
- In the Slice Values tab, select Percent under Statistic to chart in order to chart the percentage of each runtime in relation to the whole.
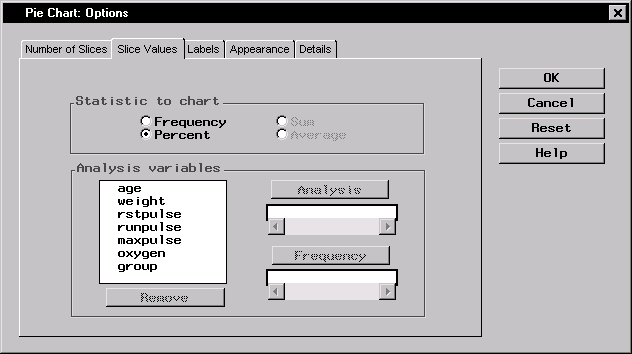
Figure 5.25: Statistic to Chart
- In the Labels tab, select Slice level under Label slices with. Select Arrow under Corresponding label placement. Each slice indicates a runtime, and each label is placed outside the disc, with an arrow pointing to the corresponding slice.
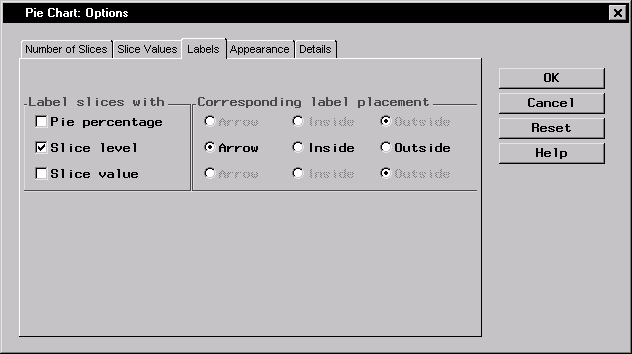
Figure 5.26: Pie Chart Labels
- In the Details tab, deselect Show default heading above chart under Chart options. You provide a new heading in the Titles dialog.
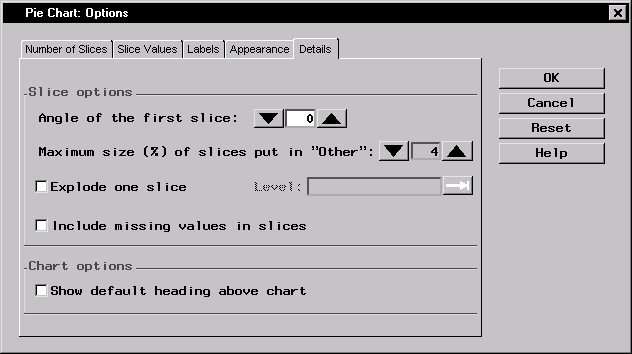
Figure 5.27: Deselect Default Heading
- Click OK to save your changes and return to the Pie Chart dialog.
Specify Pie Chart Titles
To specify the titles for your pie chart, follow these steps:- Click on the Titles button in the Pie Chart dialog.
- In the Pie Chart tab, type Percentage of Each Runtime in the first field.
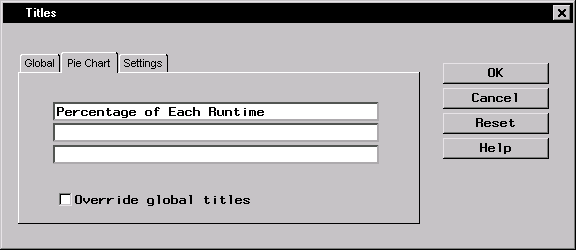
Figure 5.28: Pie Chart Title
- If you did not change the global title in the first exercise in this chapter, click on the Global tab. Type Fitness Report in the first field. This global title is saved across all Analyst sessions until you change it.
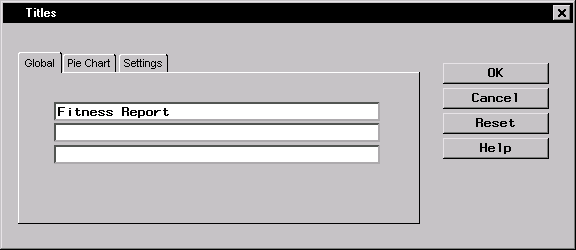
Figure 5.29: Global Title
- Click on OK to save your title changes.
Generate Pie Chart
To display your pie chart, click OK in the Pie Chart dialog.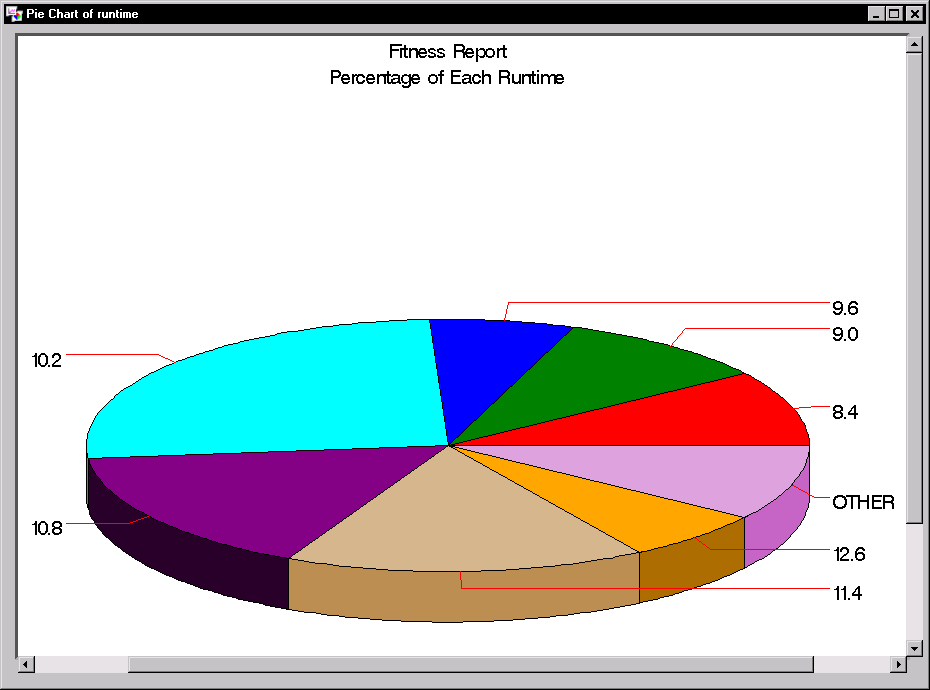 |
Figure 5.30: 3-D Pie Chart
Copyright © 2007 by SAS Institute Inc., Cary, NC, USA. All rights reserved.